I'd like to make a map of the U.S. where I draw the state lines and
apply a color to each state based on a ratio I've got in my data. I'm
staring at the example here:
http://matplotlib.sourceforge.net/screenshots/plotmap.py, but what I'm
trying to do is much simpler so I'm wondering if there's a helper
function somewhere.
thanks,
Travis
···
--
Travis Brady
tdbrady@...146...
--
http://www.fastmail.fm - Or how I learned to stop worrying and
love email again
Travis Brady wrote:
I'd like to make a map of the U.S. where I draw the state lines and
apply a color to each state based on a ratio I've got in my data. I'm
staring at the example here:
http://matplotlib.sourceforge.net/screenshots/plotmap.py, but what I'm
trying to do is much simpler so I'm wondering if there's a helper
function somewhere.
thanks,
Travis
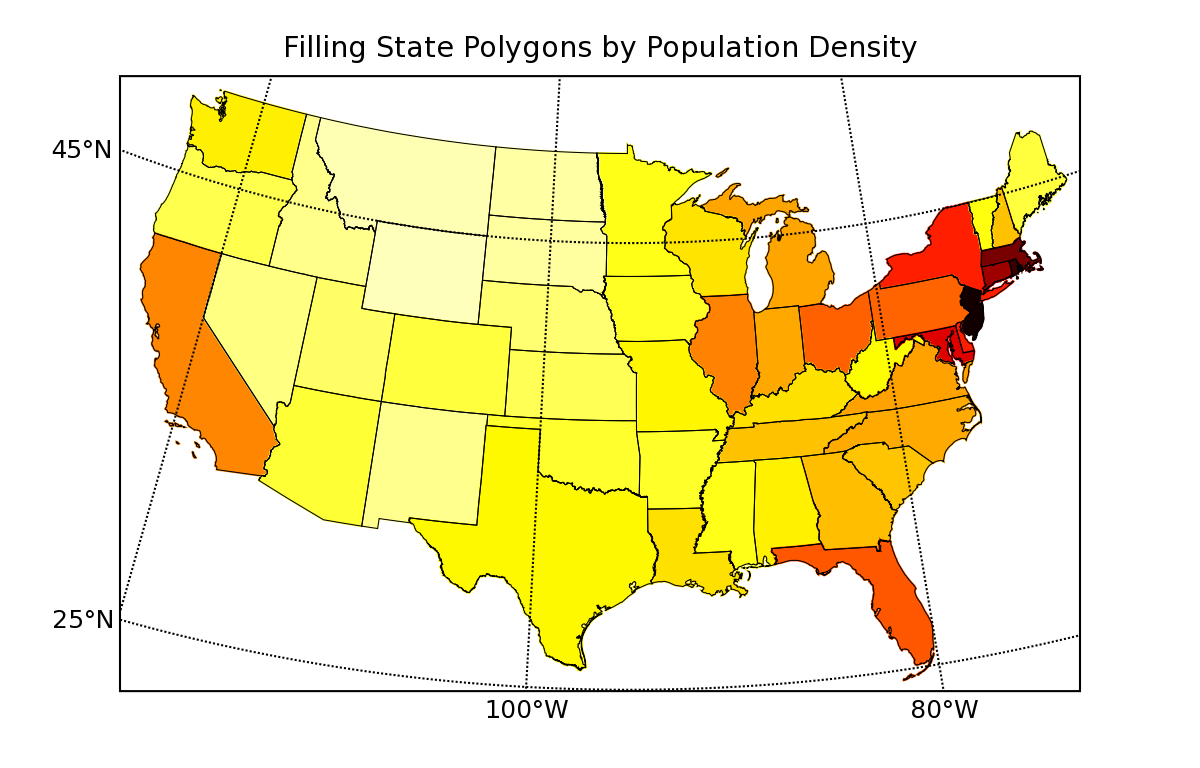
Travis: I posted an example of how to color state polygons with random colors earlier - here's a modification that colors the states based on population density. It shows how to use a colormap to choose the colors based upon your data - I think this is closer to what you were asking for.
-Jeff
fillstates.py (2.86 KB)
···
--
Jeffrey S. Whitaker Phone : (303)497-6313
Meteorologist FAX : (303)497-6449
NOAA/OAR/CDC R/CDC1 Email : Jeffrey.S.Whitaker@...259...
325 Broadway Office : Skaggs Research Cntr 1D-124
Boulder, CO, USA 80303-3328 Web : Jeffrey S. Whitaker: NOAA Physical Sciences Laboratory