Thanks Jeff
this is what I have
In [1]: import matplotlib
In [2]: matplotlib.__version__
Out[2]: '1.2.0'
I also tried with a different dataset, the one from
http://matplotlib.org/basemap/users/examples.html
and I get the same problem
from mpl_toolkits.basemap import Basemap
from netCDF4 import Dataset
import numpy as np
import matplotlib.pyplot as plt
date = '20071215' # date to plot.
# open dataset for that date.
dataset = \
Dataset('http://www.ncdc.noaa.gov/thredds/dodsC/oisst/NetCDF/AVHRR-AMSR/%s/AVHRR\-AMSR/amsr\-avhrr\-v2\.%s\.nc\.gz'%
(date[0:4],date))
# read sst. Will automatically create a masked array using
# missing_value variable attribute. 'squeeze out' singleton dimensions.
sst = dataset.variables['sst'][:].squeeze()
# read ice.
ice = dataset.variables['ice'][:].squeeze()
# read lats and lons (representing centers of grid boxes).
lats = dataset.variables['lat'][:]
lons = dataset.variables['lon'][:]
# shift lats, lons so values represent edges of grid boxes
# (as pcolor expects).
delon = lons[1]-lons[0]; delat = lats[1]-lats[0]
lons = (lons - 0.5*delon).tolist()
lons.append(lons[-1]+delon)
lons = np.array(lons,np.float64)
lats = (lats - 0.5*delat).tolist()
lats.append(lats[-1]+delat)
lats = np.array(lats,np.float64)
# create figure, axes instances.
fig = plt.figure()
ax = fig.add_axes([0.05,0.05,0.9,0.9])
m = Basemap(projection='spaeqd',lat_0=-90,lon_0=180,resolution='l',boundinglat=-40,round=True)
x, y = m(*np.meshgrid(lons, lats))
o=m.drawcoastlines(linewidth=0.25)
o=m.drawcountries(linewidth=0.25)
o=m.fillcontinents(color="grey",lake_color='white')
o=m.drawmeridians(np.arange(0,360,30),labels=[1,1,1,1])
o=m.drawparallels(np.arange(-90,90,10),labels=[1,1,1,1])
cim=m.contour(x[:-1,:-1],y[:-1,:-1],sst,arange(2,28,2),linewidths=0.5,colors='k')
plt.clabel(cim, inline=1, fontsize=10, fmt = '%.1f',)
···
On 27/02/13 19:59, Jeff Whitaker wrote:
Marcello Vichi <mailto:marcello.vichi@…4281…>
February 19, 2013 7:33 AM
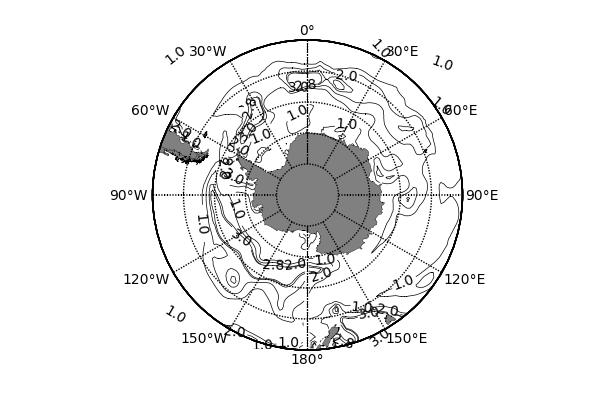
When I plot contours in a stereographic south pole plot with a
bounding latitude and the rounded clipping
Basemap(projection='spaeqd',lat_0=-90,lon_0=180,resolution='l',boundinglat=-40,round=True)
I see that the contours are correctly cut-off but not the contour
labels. They appear to be plotted according to a rectangular frame and
not the rounded one (see attached figure).
Is it possible to mask the labels without having to mask the data?
This issue may be related to an older topic:
Re: [Matplotlib-users] clabel and basemap
and to a more recent bugfix
fix for issue #88 by jswhit · Pull Request #89 · matplotlib/basemap · GitHub
but I do not see any other clue
thanks in advance
marcello
Marcello: I cannot reproduce your problem. From the github pull request
you mention, it seems like this was fixed about 3 months ago. What
version of basemap are you running?
-Jeff
--
Dr Marcello Vichi
Centro Euro-Mediterraneo sui Cambiamenti Climatici (CMCC)
Istituto Nazionale di Geofisica e Vulcanologia (INGV)
Viale Aldo Moro 44, 40127 Bologna. Italy
Tel: +39 051 3782631 Fax: +39 051 3782654
Email: [email protected]..., [email protected]...
skype: marcello_vichi