Hello,
I'm trying to follow the basemap examples in using basemap as a
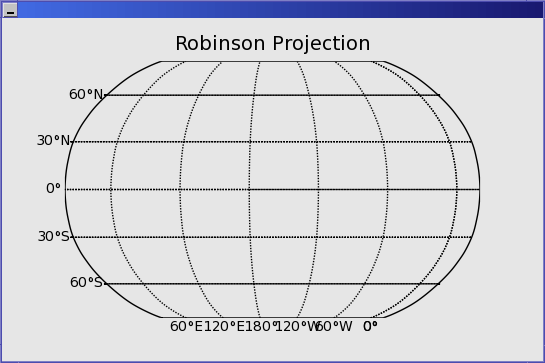
matplotlib widget within a Qt-based application. Taking the example
code
simpletest_oo.py
and modifying it to target QtAgg instead, I only get the lat/long lines,
as in the attached .png. The original example does draw all of the
continent lines and country boundaries correctly on my system.
I'm using matplotlib and basemap svn of 25 Apr 2006; the same results
were produced with 0.87.2 / 0.8.2 .
If anyone can see something obvious that I'm leaving out, I would really
appreciate a hint as to why the continents, countries, etc. are not
getting drawn.
Thank you!
Glen Mabey
######## justaplot_designer.py
from qt import *
from mplwidget import *
class Form1(QDialog):
def __init__(self,parent = None,name = None,modal = 0,fl = 0):
QDialog.__init__(self,parent,name,modal,fl)
Form1Layout = QVBoxLayout(self,11,6,"Form1Layout")
self.matplotlibWidget = MatplotlibWidget(self,"matplotlibWidget")
Form1Layout.addWidget(self.matplotlibWidget)
self.resize(QSize(322,222).expandedTo(self.minimumSizeHint()))
self.clearWState(Qt.WState_Polished)
######## basemap_simpletest_oo_qt.py
···
#####################################
# pylab-free version of simpletest.py
#####################################
# set backend to QtAgg.
import matplotlib
matplotlib.use('QtAgg')
from matplotlib.backends.backend_qt import FigureCanvasQT as FigureCanvas
from matplotlib.toolkits.basemap import Basemap
from matplotlib.figure import Figure
from matplotlib.mlab import meshgrid
import matplotlib.numerix as nx
import matplotlib.cm as cm
from matplotlib.mlab import load
import justaplot_designer
class PlotWin( justaplot_designer.Form1 ):
def __init__(self,parent = None,name = None,modal = 0,fl = 0):
justaplot_designer.Form1.__init__( self, parent, name, modal, fl )
# read in topo data (on a regular lat/lon grid)
# longitudes go from 20 to 380.
etopo = nx.array(load('etopo20data.gz'),'d')
lons = nx.array(load('etopo20lons.gz'),'d')
lats = nx.array(load('etopo20lats.gz'),'d')
# create figure.
plot_window = PlotWin()
# create axes instance, leaving room for colorbar at bottom.
ax = plot_window.matplotlibWidget.axes
# create Basemap instance for Robinson projection.
# set 'ax' keyword so pylab won't be imported.
m = Basemap(projection='robin',lon_0=0.5*(lons[0]+lons[-1]),ax=ax)
# reset figure size to have same aspect ratio as map.
# fig will be 8 inches wide.
# (don't use createfigure, since that imports pylab).
#fig.set_figsize_inches((8,m.aspect*8.))
# make filled contour plot.
x, y = m(*meshgrid(lons, lats))
cs = m.contourf(x,y,etopo,30,cmap=cm.jet)
# draw coastlines.
m.drawcoastlines()
# draw a line around the map region.
m.drawmapboundary()
# draw parallels and meridians.
m.drawparallels(nx.arange(-60.,90.,30.),labels=[1,0,0,0],fontsize=10)
m.drawmeridians(nx.arange(0.,420.,60.),labels=[0,0,0,1],fontsize=10)
# add a title.
ax.set_title('Robinson Projection')
# add a colorbar.
#cax = fig.add_axes([0.125, 0.05, 0.75, 0.05],frameon=False)
#fig.colorbar(cs, cax=cax, tickfmt='%d', orientation='horizontal',clabels=cs.levels[::3])
# save image (width 800 pixels with dpi=100 and fig width 8 inches).
plot_window.matplotlibWidget.draw()
plot_window.show()
plot_window.exec_loop()