bar centers on the y axis p1 = figure.gca().barh(pos,val)
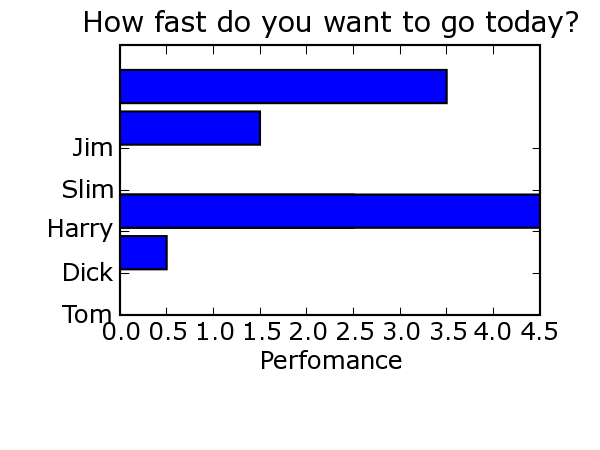
> figure.gca().set_yticklabels(('Tom', 'Dick', 'Harry',
> 'Slim', 'Jim')) figure.gca().set_xlabel('Perfomance')
> figure.gca().set_title('How fast do you want to go
> today?') canvas=FigureCanvasAgg(figure) return canvas
In the example you are following, the code reads
yticks(pos, ('Tom', 'Dick', 'Harry', 'Slim', 'Jim'))
This sets the ytick locations and labels. You are only setting the
locations, and so you are incorrectly placing a tick and label at 0.
You want
ax.set_yticks(pos)
ax.set_yticklabels(('Tom', 'Dick', 'Harry', 'Slim', 'Jim'))
JDH