Hi everyone,
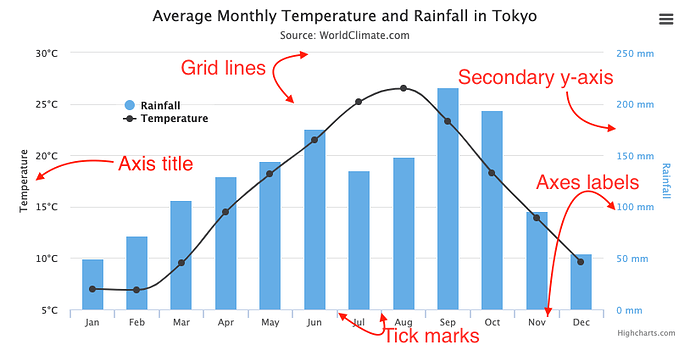
I’m trying to make a horizontal bar chart with string tick labels. I would like to center labels between ticks but I only find a solution for line plot with numeric labels (Centering labels between ticks — Matplotlib 3.4.2 documentation).
Please refer to the following picture for illustration. If we ignore the line plot in the picture, and take the x tick labels as text, how may I reproduce this example in matplotlib? Many thanks!
You cannot put tick labels where there are no ticks. But what you can do is use the major and minor ticks to achieve what you want.
Set one (say the major ticks) to have zero-length ticks, and the months (e.g., with ConciseDateFormatter), and the other (the minor ticks) to be somewhat long, but with no text.
Yea for dates it might work but my ticklabels are just words, says Apple, Banana… I understand the logic that we may put Majortick w/o ticklabel and minortick with the tick label, but how may I do it for matplotlib?
You can make the major ticks have zero length, and the minor ticks have finite length and one tick between each major tick. But we do not have an automatic way to make what you want.
Thanks! is there any reference I may refer to? I’m struggling to change the length of ticks and keep the major tick labels at the same time
I don’t think that’s the reference I’m looking for. Basically I was searching for a way to separately control the tick length of major and minor ticks, but this page shows tick formatters which define how the numeric value associated with a tick on an axis is formatted as a string.
The second example is exactly what you are looking for.
For the minor ticks, you can set an auto locator with n=2; this is the example in its docstring:
https://matplotlib.org/stable/api/ticker_api.html#matplotlib.ticker.AutoMinorLocator
