I have a time series, which is a pandas.Series indexed by a pandas.DatetimeIndex. That this series is hourly (one point per hour). When I plot it, and try to overlay on the graph some shaded areas with axvspan(), with time points that are with higher precision, those data are truncated to hourly precision.
Here is a minimal example:
#!/usr/bin/env python3

import matplotlib.pyplot as plt
import pandas as pd

dates = pd.DatetimeIndex(['2021-01-01 08:00:00', '2021-01-01 09:00:00', '2021-01-01 10:00:00'])
ts_temp = pd.Series([0.5, 0.2, 0.7], index=dates)

fig, ax1 = plt.subplots()
ts_temp.plot(ax=ax1)
ax1.axvspan('2021-01-01 08:30:00', '2021-01-01 09:30:00', facecolor='orange', alpha=0.15)
plt.show()
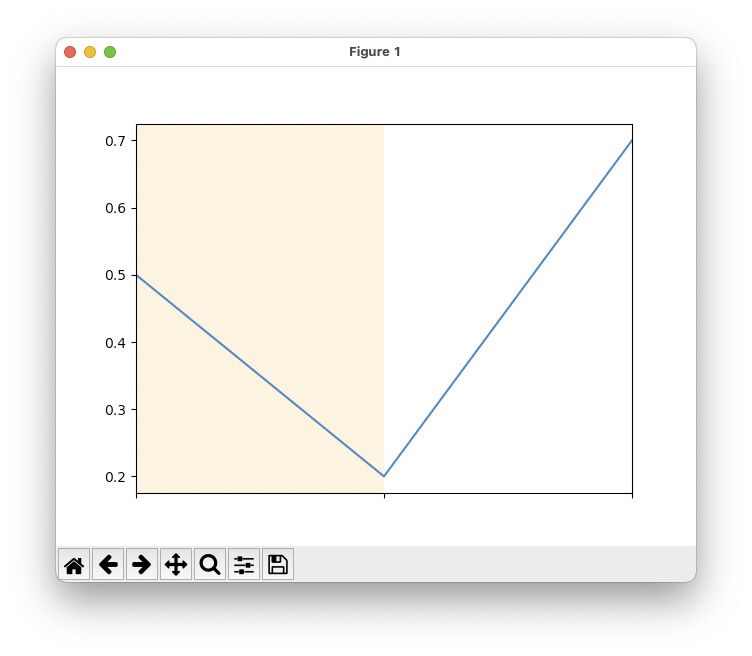
I have hourly points, which are plotted well. But you can see that the shaded areas, which is supposed to start at 8:30 and stop at 9:30, is instead “truncated” to 8:00 to 9:00. See the plot:
Why is this happening, and how can it be fixed?
You are passing strings not dates to axvspan. I’m surprised that works at all. Suggest passing date objects (however you do that in pandas)
@jklymak Matplotlib accepts properly formatted strings as dates. Passing datetime objects still has the same issue.
Maybe pandas date converter accepts strings as dates, but Matplotlib itself currently does not. (I suppose we could, but that would be a feature request)
@jklymak The same example with datetime objects, fails exactly the same way:
#!/usr/bin/env python3

import datetime
import matplotlib.pyplot as plt
import pandas as pd

dates = pd.DatetimeIndex(['2021-01-01 08:00:00', '2021-01-01 09:00:00', '2021-01-01 10:00:00'])
ts_temp = pd.Series([0.5, 0.2, 0.7], index=dates)

fig, ax1 = plt.subplots()
ts_temp.plot(ax=ax1)
ax1.axvspan(datetime.datetime(2021,1,1,8,30,0), datetime.datetime(2021,1,1,9,30,0), facecolor='orange', alpha=0.15)
plt.show()
Sure, you are still using the pandas converters. Pure matplotlib
import matplotlib.pyplot as plt
import numpy as np
import matplotlib as mpl

fig, axs = plt.subplots(2, 1)

dates = np.array(['2021-01-01 08:00:00', '2021-01-01 09:00:00', '2021-01-01 10:00:00'], dtype='datetime64')
ts_temp = np.array([0.5, 0.2, 0.7])

fig, ax1 = plt.subplots()
ax1.plot(dates, ts_temp)
x1 = np.datetime64('2021-01-01 08:30:00')
x2 = np.datetime64('2021-01-01 09:30:00')
ax1.axvspan(x1, x2, facecolor='orange')

plt.show()
works as expected. (I was too lazy to do with datetime, vs datetime64, but it will behave the same way)
To get this to work with pandas, you will need to convert your axvspan x1 and x2 to whatever object Pandas uses as a datetime object. I don’t use pandas, so can’t advise specifically.
1 Like