A while back, I wrote some functions to calculate a good set of parameters for subplots_adjust (see attached; examples in if-main block at bottom). I've been using these functions pretty regularly, and it works pretty well for my purposes.
Best,
-Tony
Some usage notes:
The function has to draw the figure a couple of times to calculate correct spacing. When redrawing the figure (e.g. when you resize the window), you'd have to re-call the function, which would redraw the figure a couple of times before drawing the final figure. That's all to say: this is a fairly slow function. If you don't have subplots (like in your example), you can call "layout.tight_borders()" (instead of "layout.tight()"), which only requires a single redraw.
When I originally posted this to the developers list, the functions didn't work with the GtkAgg backend. As far as I know, this hasn't changed. It should work fine for Qt4Agg, macosx, and TkAgg backends.
On Fri, 2010-09-17 at 09:46 -0400, Tony S Yu wrote:
On Sep 17, 2010, at 8:58 AM, Erik Janssens wrote:
> Hi,
>
> I'm using matplotlib in a pyqt context, as described
> in the book 'Matplotlib for python developers'.
>
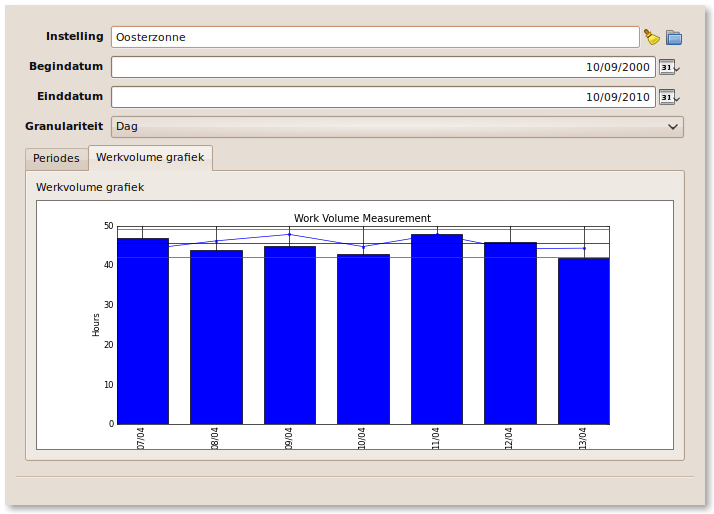
> When the window is large enough, everything works
> fine, but when the window is too small part of
> the x-axis labels get chopped.
>
> Is there a way to prevent this ? Preferable
> in combination with the user being able to
> resize the window.
>
> Thanks a lot,
>
> Erik
A while back, I wrote some functions to calculate a good set of parameters for subplots_adjust (see attached; examples in if-main block at bottom). I've been using these functions pretty regularly, and it works pretty well for my purposes.
Best,
-Tony
Some usage notes:
The function has to draw the figure a couple of times to calculate correct spacing. When redrawing the figure (e.g. when you resize the window), you'd have to re-call the function, which would redraw the figure a couple of times before drawing the final figure. That's all to say: this is a fairly slow function. If you don't have subplots (like in your example), you can call "layout.tight_borders()" (instead of "layout.tight()"), which only requires a single redraw.
When I originally posted this to the developers list, the functions didn't work with the GtkAgg backend. As far as I know, this hasn't changed. It should work fine for Qt4Agg, macosx, and TkAgg backends.
A while back, I wrote some functions to calculate a good set of parameters
for subplots_adjust (see attached; examples in if-main block at bottom).
I've been using these functions pretty regularly, and it works pretty well
for my purposes.
The function has to draw the figure a couple of times to calculate correct
spacing. When redrawing the figure (e.g. when you resize the window),
you'd have to re-call the function, which would redraw the figure a couple
of times before drawing the final figure. That's all to say: this is a
fairly slow function. If you don't have subplots (like in your example),
you can call "layout.tight_borders()" (instead of "layout.tight()"), which
only requires a single redraw.
When I originally posted this to the developers list, the functions didn't
work with the GtkAgg backend. As far as I know, this hasn't changed. It
should work fine for Qt4Agg, macosx, and TkAgg backends.
Hi Tony,
I copied your layout.py.
Then run the following python script:
···
------------------------------------------------------
import matplotlib.pyplot as plt
import layout
import random
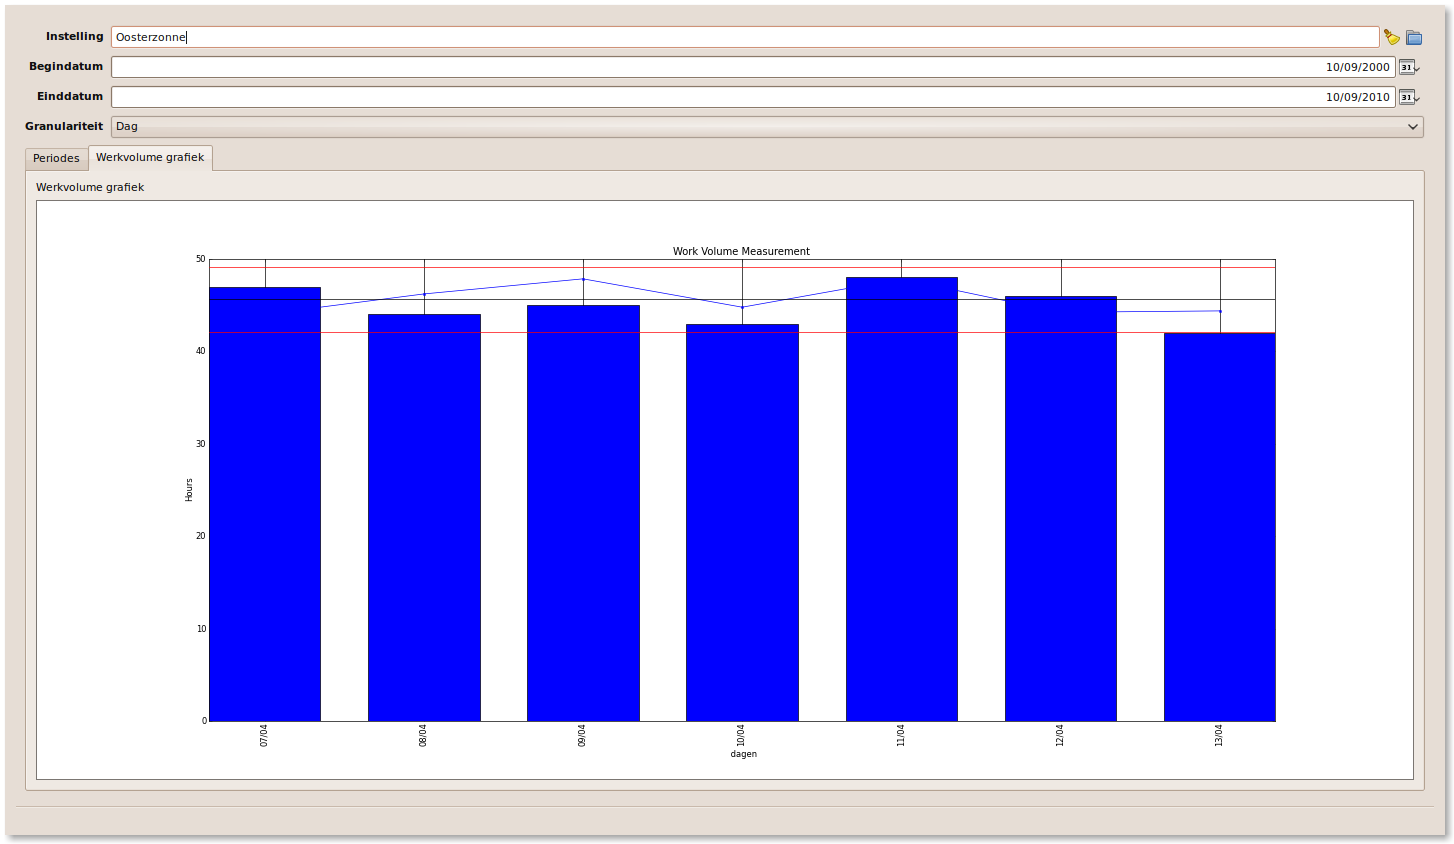
Without the resize event it works as expected.
With the resize event (as you suggested),
it only adjusts the borders of the four axes to the outside of the figure.
But between the axes there is no space at all.