Hello,
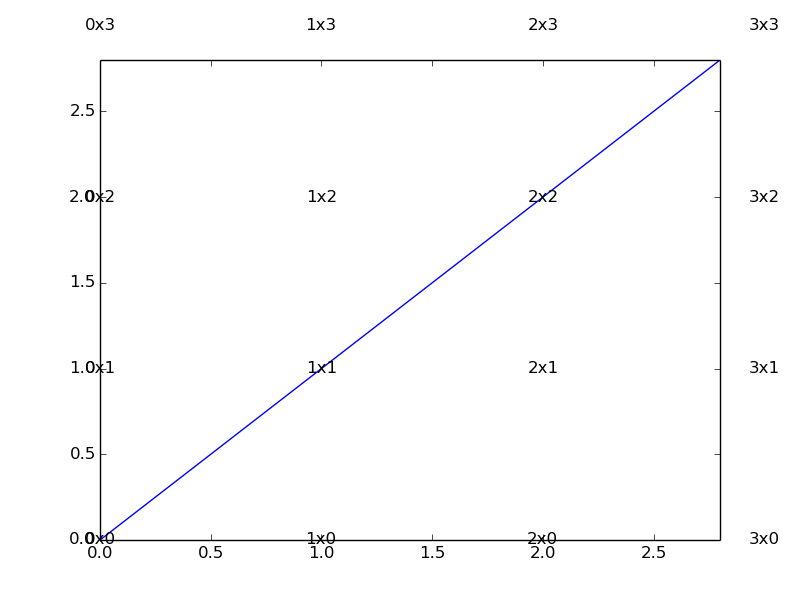
I’m wondering why stuff plotted with ax.text() does not get “clipped” by the axes bounds on the plot. Here’s a simple example, run with 1.3.1:
import matplotlib.pyplot as plt
(fig, ax) = plt.subplots(1,1)
for i in range(5):
for j in range(5):
ax.text(i,j, “%sx%s” % (i,j), ha=‘center’, va=‘center’)
ax.plot([0,8],[0,8])
ax.set_xlim(0,2.8)
ax.set_ylim(0,2.8)
fig.savefig(‘test.png’)
and attached output. This causes me lots of grief with basemap as well. Is there a non-brute-force trick to get these values plotted outside the axes bounds removed?
daryl
I can't quite remember what the original issue was, but I do seem to recall
that this behavior was made intentional for some reason. I honestly can't
remember why, though, and I can't fathom what circumstances that this would
be desirable...
Ben Root
···
On Wed, Jan 22, 2014 at 9:21 AM, Daryl Herzmann <[email protected]...> wrote:
Hello,
I'm wondering why stuff plotted with ax.text() does not get "clipped" by
the axes bounds on the plot. Here's a simple example, run with 1.3.1:
import matplotlib.pyplot as plt
(fig, ax) = plt.subplots(1,1)
for i in range(5):
for j in range(5):
ax.text(i,j, "%sx%s" % (i,j), ha='center', va='center')
ax.plot([0,8],[0,8])
ax.set_xlim(0,2.8)
ax.set_ylim(0,2.8)
fig.savefig('test.png')
and attached output. This causes me lots of grief with basemap as well.
Is there a non-brute-force trick to get these values plotted outside the
axes bounds removed?
daryl
Often, the text is an annotation that you would not want to have
clipped.
ax.text(i,j, "%sx%s" % (i,j), ha='center',
va='center').set_clip_on(True)
will turn the clipping on for the text.
Mike
···
On 01/22/2014 09:43 AM, Benjamin Root
wrote:
On Wed, Jan 22, 2014 at 9:21 AM,
Daryl Herzmann <akrherz@…287…> wrote:
Hello,
I'm wondering why stuff plotted with ax.text() does
not get “clipped” by the axes bounds on the plot.
Here’s a simple example, run with 1.3.1:
import matplotlib.pyplot as plt
(fig, ax) = plt.subplots(1,1)
for i in range(5):
for j in range(5):
ax.text(i,j, "%sx%s" % (i,j), ha='center',
va=‘center’)
ax.plot([0,8],[0,8])
ax.set_xlim(0,2.8)
ax.set_ylim(0,2.8)
fig.savefig(‘test.png’)
and attached output. This causes me lots of grief
with basemap as well. Is there a non-brute-force
trick to get these values plotted outside the axes
bounds removed?
daryl
I can't quite remember what the original issue was, but
I do seem to recall that this behavior was made
intentional for some reason. I honestly can’t remember
why, though, and I can’t fathom what circumstances that
this would be desirable…
-- _ |\/|o _|_ _. _ | | \.__ __|__|_|_ _ _ ._ _ | ||(_| |(_|(/_| |_/|(_)(/_|_ |_|_)(_)(_)| | |
http://www.droettboom.com