Success! There were two separate issues at play here. First, there was a slight mistake in calculating the 2D label location from the 3D location of the axis mid-point. This caused labels to not appear centered along the axis. This has been a long-standing bug that is now resolved by my patch.
The second issue is that when a Text object is given a rotation (in this case, by the Axis3D object). The rotation angle that a Text object expects is assumed to be for the display coordinate system. The angle that was calculated was for the axes coordinate system, which caused problems when the axes display aspect ratio was not equal (or square?). I might be mixing up some of the details because of the assumptions that are made in mplot3d.
A permanent solution would be to address the issue of how the rotation angle should be interpreted in a Text object. I can imagine several cases in 2D plots where the current behavior is undesirable.
However, for the purposes of mplot3d, because of its architecture, this angle gets recalculated for every re-draw anyway, so I decided to just properly calculate the angle at that point instead. I also made sure that the text object knows that I want its anchor point to be in the center of the text object for both horizontal and vertical alignment to make sure the object gets displayed properly.
I have attached the patch here. Feel free to try and break the alignment in case I missed something.
Ben Root
axis3d_label_fix.patch (2.04 KB)
···
On Thu, Nov 11, 2010 at 12:20 PM, Benjamin Root <ben.root@…3203…04…> wrote:
On Thu, Nov 11, 2010 at 9:31 AM, James Davidheiser <jdavidheiser@…3346…> wrote:
From: ben.v.root@…287… [mailto:ben.v.root@…1972…] On Behalf Of Benjamin Root
Sent: Thursday, November 11, 2010 8:19 AM
To: James Davidheiser
Cc: [email protected]
Subject: Re: [Matplotlib-users] Axes labels crooked using mplot3d in WX
On Thu, Nov 11, 2010 at 8:49 AM, James Davidheiser <jdavidheiser@…3346…> wrote:
From: ben.v.root@…287… [mailto:ben.v.root@…2015…87…] On Behalf Of Benjamin Root
On Wed, Nov 10, 2010 at 3:12 PM, unij <jdavidheiser@…3346…> wrote:
I’m trying to use mplot3d in a Wx based application, and most things seem to
be working fine. The one issue that keeps tripping me up is that the axes
labels are drawn at a weird angle. If I do the same type of plot withoutusing wx, then this problem goes away. I am completely stumped as to where
to even begin looking to fix this problem, so I would appreciate any
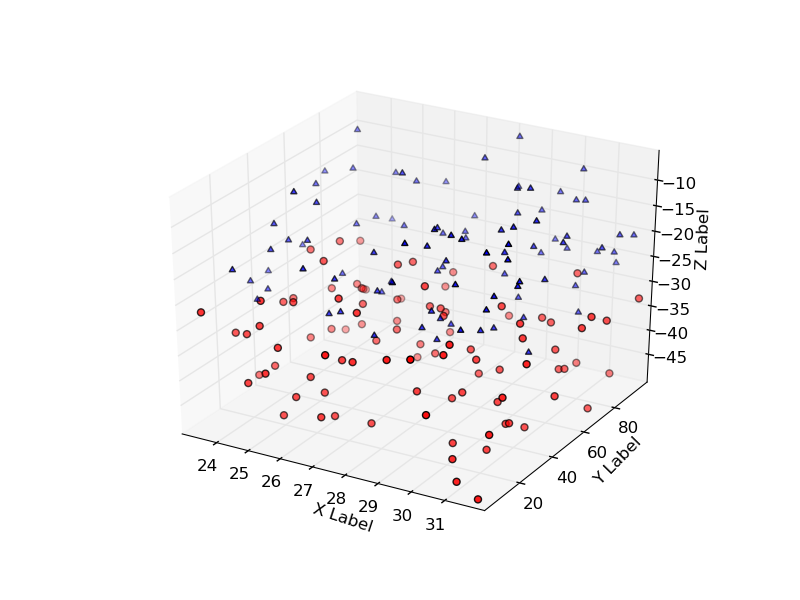
pointers you can give me.I’ve attached a screenshot showing what I am talking about - a simple plot
where the axes labels look strange.
I can reproduce the weird angle issue, but I can’t seem to find a backend where it doesn’t occur. Could you run “import matplotlib; print matplotlib.get_backend()” to determine which backend you are using when everything looks ok? Also, could you report the output of “matplotlib.version”?
If it happens for all backends then the problem is in mplot3d/axis3d.py. Unfortunately, the code there is a little light on commenting, but i don’t notice any glaring mathematical error off the bat.
Ben Root
That’s actually a really good point and something I didn’t explain well – I didn’t go out of my way to test with other backends, but rather I tried it by recreating the plot independently of my GUI, creating the same plot using pyplot, following the example in scatter3d_demo.py from the sourceforge demos page. If I then import matplotlib and check the backend, I get that it’s TkAgg, but I’m not sure whether that backend is actually being used – is it?
I did just try changing between Wx and WxAgg for the backends, and the positions of the labels definitely move around in weird ways between the two, so I think I’m now even more confused than I was before.
James
The difference between a gui kit like Wx and its Agg equivalent is probably expected. Agg renderers bring additional capabilities and functionality with respect to rendering special vector-based graphics such as fonts. For example, while examining this bug, I noticed that the GTK backend can only represent fonts with either a 0 degree rotation, or 90 degree rotation, while the GTKAgg doesn’t have that limitation.
I have tested Wx, WxAgg, GTK, GTKAgg, QTAgg, QT4Agg, and TkAgg and have found them all to be rotating the text incorrectly. GTK doesn’t rotate at all, and emits an error (I wonder if we can catch this and perform an appropriate failback?). Wx does not appear to be performing the translation step properly, causing the label to appear on top of the tick labels. The other backends all seem to have similar results.
I wonder if the calculation for the text angle is off because maybe it is not using all 3 dimensions? In other words, the text appear to fail to take into account depth perception. I will take another peek at the code and see what I can figure out.
Ben Root
I also noticed that the problem is dependent on window / frame dimensions – resize the frame, and the angle changes. For nearly square windows, the angles are almost correct, but as you go to more rectangular aspect ratios, the text gets skewed. I’m guessing that means the error has something to do with the assumptions the code is making about how the window is scaled, which break down when you’re not in a square.
James
Astute observation. Digging further, I have noticed that the source of the problem is that the angle given to a text object is relative to the display coordinate system. So, no matter how one resizes the figure window, the text angle is always the same. When the aspect ratio is square, then everything lines up right. I am going to look into making text objects aware of transforms for rotation purposes to fix this problem.
Ben Root