I'm implementing a strip chart class by setting the data in a Line2D
(well, one or more Line2D instances tied to one or more Subplots).
However, I find that when I do this I can't get the y axis to autoscale,
even if I create the Line2Ds with animate=False.
Am I overlooking something really basic? If not, any suggestions?
Perhaps I should keep track of the y limits myself. That saves time when
adding a new data point because I can compare it to cached limits
(instead of scanning the whole data set). But it quickly gets messy if
one handles nan correctly and matplotlib already does this so I was
thinking matplotlib must have API code to help with this. But so far
I've not figured it out from the docs (though matplotlib.ticker looks
promising).
-- Russell
Did you try autoscale_view method?
http://matplotlib.sourceforge.net/api/axes_api.html?highlight=autoscale#matplotlib.axes.Axes.autoscale_view
Please post a sample script that reproduces the problem.
Regards,
-JJ
···
On Sat, Sep 25, 2010 at 8:15 AM, Russell E. Owen <[email protected]...> wrote:
Perhaps I should keep track of the y limits myself. That saves time when
adding a new data point because I can compare it to cached limits
(instead of scanning the whole data set). But it quickly gets messy if
one handles nan correctly and matplotlib already does this so I was
thinking matplotlib must have API code to help with this. But so far
I've not figured it out from the docs (though matplotlib.ticker looks
promising).
Mmh,
Did you try autoscale_view method?
http://matplotlib.sourceforge.net/api/axes_api.html?highlight=autoscale#matplotlib.axes.Axes.autoscale_view
Please post a sample script that reproduces the problem.
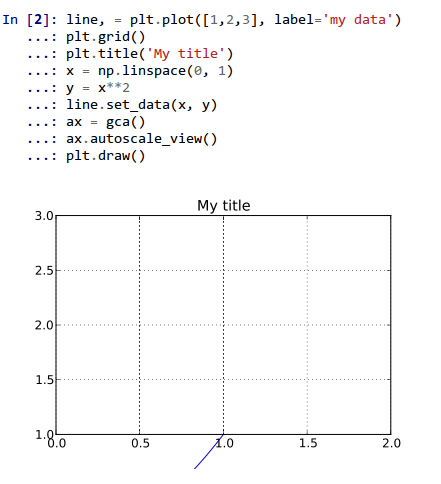
I'm wondering if I'm doing something wrong then. Just now I was
writing some notes about this for a tutorial, and tried this code:
line, = plt.plot([1,2,3], label='my data')
plt.grid()
plt.title('My title')
x = np.linspace(0, 1)
y = x**2
line.set_data(x, y)
ax = gca()
ax.autoscale_view()
plt.draw()
but I get the result shown in the screenshot. Am I misusing
autoscale_view? As best I can tell from the docstring, I'm making
correct use of it, but perhaps I'm missing something...
Cheers,
f
···
On Sun, Sep 26, 2010 at 10:56 PM, Jae-Joon Lee <[email protected]...> wrote:
Mmh,
Did you try autoscale_view method?
http://matplotlib.sourceforge.net/api/axes_api.html?highlight=autoscale#matplotlib.axes.Axes.autoscale_view
Please post a sample script that reproduces the problem.
I'm wondering if I'm doing something wrong then. Just now I was
writing some notes about this for a tutorial, and tried this code:
line, = plt.plot([1,2,3], label='my data')
plt.grid()
plt.title('My title')
x = np.linspace(0, 1)
y = x**2
line.set_data(x, y)
ax = gca()
ax.autoscale_view()
plt.draw()
but I get the result shown in the screenshot. Am I misusing
autoscale_view? As best I can tell from the docstring, I'm making
correct use of it, but perhaps I'm missing something...
autoscale_view somewhat defeats the purpose of line.set_data, which is intentionally minimalist. If you want autoscaling after update, but don't want to simply clear and plot, then you need to explicitly update the Axes.dataLim. You can do this using Axes.relim()
prior to calling autoscale_view().
Eric
···
On 09/26/2010 09:43 PM, Fernando Perez wrote:
On Sun, Sep 26, 2010 at 10:56 PM, Jae-Joon Lee<[email protected]...> wrote:
Cheers,
f
------------------------------------------------------------------------------
Start uncovering the many advantages of virtual appliances
and start using them to simplify application deployment and
accelerate your shift to cloud computing.
http://p.sf.net/sfu/novell-sfdev2dev
_______________________________________________
Matplotlib-users mailing list
[email protected]
matplotlib-users List Signup and Options
Aha! That's the call I missed, thanks a bunch. Perhaps a note
indicating that in the autoscale_view docstring wouldn't hurt, because
as it reads now I think the confusion I had is an easy one to fall
into.
Many thanks! I added this to my tutorial notes 
Cheers,
f
···
On Mon, Sep 27, 2010 at 1:23 AM, Eric Firing <[email protected]...> wrote:
You can do this using Axes.relim()
prior to calling autoscale_view().