Hello everybody,
I currently experience some problem with arrows in polar
plots.
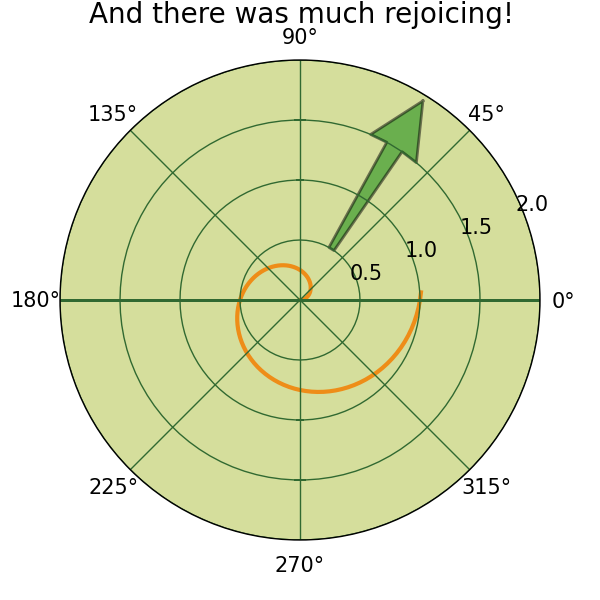
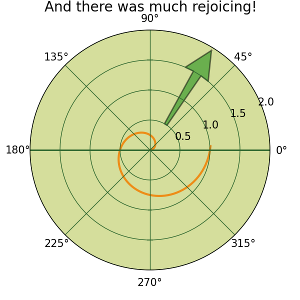
Everything is fine, as long as the arrow does not cross
the zero line. Here is an example from the matplotlib
gallery
(http://matplotlib.sourceforge.net/examples/pylab_examples/polar_demo.html),
but with an arrow pointing at 45� outward.
To create the arrow I just added the following line:
arr = plt.arrow(45, 0.5, 0,1 , alpha = 0.5, width = 0.1,
edgecolor = 'black', facecolor = 'green',lw = 2)
You can find the complete source code at the end of the
mail.
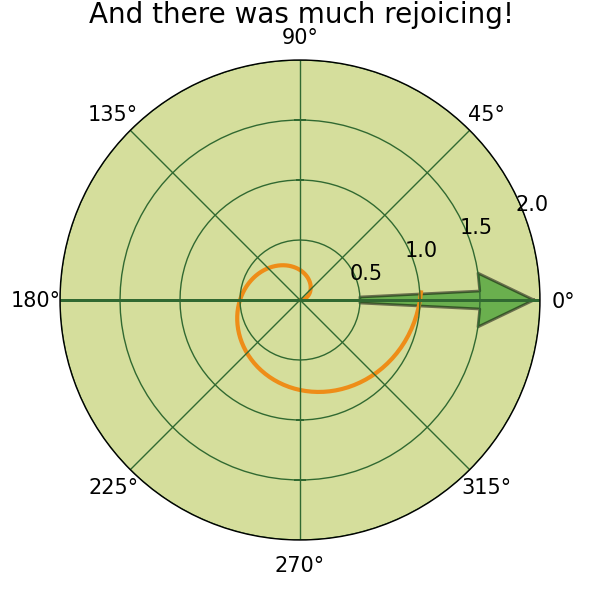
If I want to point the arrow in zero direction,
arr = plt.arrow(0, 0.5, 0,1 , alpha = 0.5, width = 0.1,
edgecolor = 'black', facecolor = 'green',lw = 2)
there is only the silhouette of an arrow visible, but
nearly everthing seems to be green (as the arrow should
be). For me it seems as there are some problems with the
periodicity in polar plots.
Does anyone have an idea or a workaround?
Thank you very much in advance
Marie-Therese
···
---------------------------------------------------------------------------
Source code to reproduce the zero direction "arrow"
import matplotlib
import numpy as np
from matplotlib.pyplot import figure, show, rc, grid
# radar green, solid grid lines
rc('grid', color='#316931', linewidth=1, linestyle='-')
rc('xtick', labelsize=15)
rc('ytick', labelsize=15)
# force square figure and square axes looks better for
polar, IMO
width, height = matplotlib.rcParams['figure.figsize']
size = min(width, height)
# make a square figure
fig = figure(figsize=(size, size))
ax = fig.add_axes([0.1, 0.1, 0.8, 0.8], polar=True,
axisbg='#d5de9c')
r = np.arange(0, 3.0, 0.01)
theta = 2*np.pi*r
ax.plot(theta, r, color='#ee8d18', lw=3)
ax.set_rmax(2.0)
grid(True)
ax.set_title("And there was much rejoicing!", fontsize=20)
#This is the line I added:
arr = plt.arrow(0, 0.5, 0,1 , alpha = 0.5, width = 0.1,
edgecolor = 'black', facecolor = 'green',lw = 2)
show()