Hi,
I have some SVGs with closed Bezier curve paths that I’d like to convert to matplotlib paths.
For example, here is some code: https://gist.github.com/moorepants/4cac02e798446bb46de7
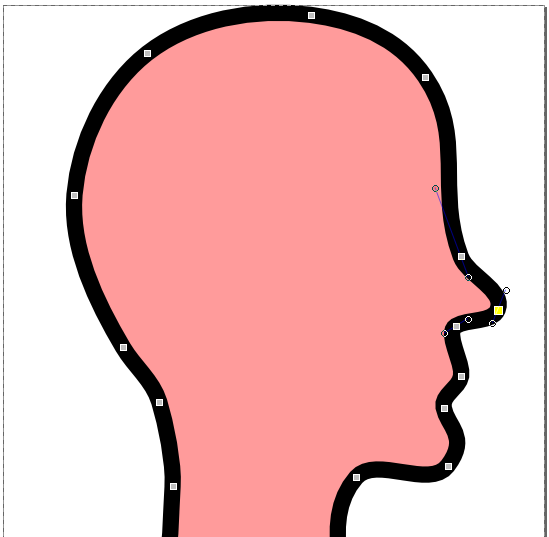
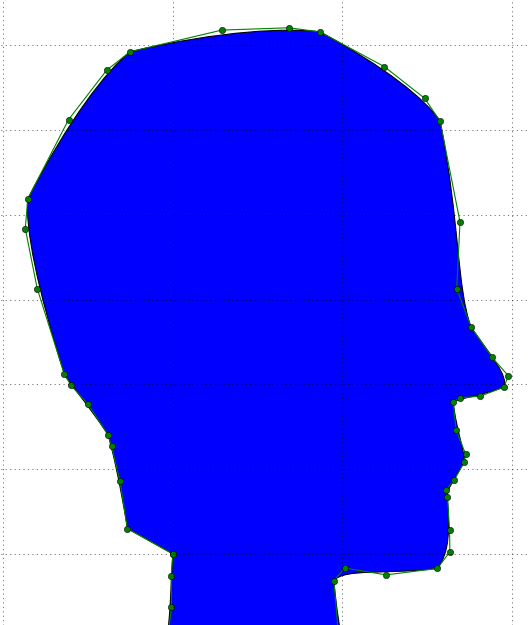
The above script runs but the resulting path in matplotlib is less smooth that when opened in inkscape, for example. I’ve attached screenshots.
I’m not sure why there is a difference.
Any suggestions to get my matplotlib curves looking as smooth as they do in SVG format?


···
Jason
moorepants.info
+01 530-601-9791
Here is a (limited) SVG path parser I made some time ago:
https://github.com/rougier/LinuxMag-HS-2014/blob/master/matplotlib/firefox.py
The svg_parse function might just do what you're trying to achieve.
Nicolas
···
On 04 Mar 2015, at 20:51, Jason Moore <moorepants@...287...> wrote:
Hi,
I have some SVGs with closed Bezier curve paths that I'd like to convert to matplotlib paths.
For example, here is some code: https://gist.github.com/moorepants/4cac02e798446bb46de7
The above script runs but the resulting path in matplotlib is less smooth that when opened in inkscape, for example. I've attached screenshots.
I'm not sure why there is a difference.
Any suggestions to get my matplotlib curves looking as smooth as they do in SVG format?
Jason
moorepants.info
+01 530-601-9791
<Selection_057.png><Selection_058.png>------------------------------------------------------------------------------
Dive into the World of Parallel Programming The Go Parallel Website, sponsored
by Intel and developed in partnership with Slashdot Media, is your hub for all
things parallel software development, from weekly thought leadership blogs to
news, videos, case studies, tutorials and more. Take a look and join the
conversation now. http://goparallel.sourceforge.net/_______________________________________________
Matplotlib-users mailing list
Matplotlib-users@lists.sourceforge.net
https://lists.sourceforge.net/lists/listinfo/matplotlib-users
Thanks Nicolas for your code.
The difference in what I have and what you share is in the svg path specification. For some reason Inkscape outputs a single leading “c” for the bezier curve in my path whereas your path has a “c” for every three points. I’m not quite sure the difference, maybe Inkscape outputs a non-standard form.
···
On Wed, Mar 4, 2015 at 1:53 PM, Nicolas P. Rougier <Nicolas.Rougier@…3782…> wrote:
Here is a (limited) SVG path parser I made some time ago:
https://github.com/rougier/LinuxMag-HS-2014/blob/master/matplotlib/firefox.py
The svg_parse function might just do what you’re trying to achieve.
Nicolas
On 04 Mar 2015, at 20:51, Jason Moore <moorepants@…287…> wrote:
Hi,
I have some SVGs with closed Bezier curve paths that I’d like to convert to matplotlib paths.
For example, here is some code: https://gist.github.com/moorepants/4cac02e798446bb46de7
The above script runs but the resulting path in matplotlib is less smooth that when opened in inkscape, for example. I’ve attached screenshots.
I’m not sure why there is a difference.
Any suggestions to get my matplotlib curves looking as smooth as they do in SVG format?
Jason
moorepants.info
+01 530-601-9791
<Selection_057.png><Selection_058.png>------------------------------------------------------------------------------
Dive into the World of Parallel Programming The Go Parallel Website, sponsored
by Intel and developed in partnership with Slashdot Media, is your hub for all
things parallel software development, from weekly thought leadership blogs to
news, videos, case studies, tutorials and more. Take a look and join the
conversation now. http://goparallel.sourceforge.net/_______________________________________________
Matplotlib-users mailing list
Matplotlib-users@lists.sourceforge.net
https://lists.sourceforge.net/lists/listinfo/matplotlib-users
Jason
moorepants.info
+01 530-601-9791
Actually the notation I have is valid SVG path data. Your script could be modified to handle the more general forms, see:
http://www.w3.org/TR/SVG/paths.html#PathDataGeneralInformation
But this still doesn’t answer why the smoothness is different between the SVG and matploblib paths. I haven’t been able to figure that out yet.
···
On Wed, Mar 4, 2015 at 2:32 PM, Jason Moore <moorepants@…287…> wrote:
Thanks Nicolas for your code.
The difference in what I have and what you share is in the svg path specification. For some reason Inkscape outputs a single leading “c” for the bezier curve in my path whereas your path has a “c” for every three points. I’m not quite sure the difference, maybe Inkscape outputs a non-standard form.
Jason
moorepants.info
+01 530-601-9791
Jason
moorepants.info
+01 530-601-9791
On Wed, Mar 4, 2015 at 1:53 PM, Nicolas P. Rougier <Nicolas.Rougier@…3782…> wrote:
Here is a (limited) SVG path parser I made some time ago:
https://github.com/rougier/LinuxMag-HS-2014/blob/master/matplotlib/firefox.py
The svg_parse function might just do what you’re trying to achieve.
Nicolas
On 04 Mar 2015, at 20:51, Jason Moore <moorepants@…287…> wrote:
Hi,
I have some SVGs with closed Bezier curve paths that I’d like to convert to matplotlib paths.
For example, here is some code: https://gist.github.com/moorepants/4cac02e798446bb46de7
The above script runs but the resulting path in matplotlib is less smooth that when opened in inkscape, for example. I’ve attached screenshots.
I’m not sure why there is a difference.
Any suggestions to get my matplotlib curves looking as smooth as they do in SVG format?
Jason
moorepants.info
+01 530-601-9791
<Selection_057.png><Selection_058.png>------------------------------------------------------------------------------
Dive into the World of Parallel Programming The Go Parallel Website, sponsored
by Intel and developed in partnership with Slashdot Media, is your hub for all
things parallel software development, from weekly thought leadership blogs to
news, videos, case studies, tutorials and more. Take a look and join the
conversation now. http://goparallel.sourceforge.net/_______________________________________________
Matplotlib-users mailing list
Matplotlib-users@lists.sourceforge.net
https://lists.sourceforge.net/lists/listinfo/matplotlib-users
Actually, both syntax are valid.
I think the problem in you svg parser is that you're changing the reference point each time you iterate in points.
For example consider the path:
m 100,200 c 100,100 400,100 400,200 z => (m P0 c P1 P2 P3 z)
Your parser ended with vertex at (100.0, -200.0), (200.0, -300.0), (600.0, -400.0), (1000.0, -600.0)
which corresponds to [P0, P0+P1, P1+P2, P2+P3] but you want [P0, P0+P1, P0+P2, P0+P3]
Nicolas
···
On 05 Mar 2015, at 00:35, Jason Moore <moorepants@...287...> wrote:
Actually the notation I have is valid SVG path data. Your script could be modified to handle the more general forms, see:
http://www.w3.org/TR/SVG/paths.html#PathDataGeneralInformation
But this still doesn't answer why the smoothness is different between the SVG and matploblib paths. I haven't been able to figure that out yet.
Jason
moorepants.info
+01 530-601-9791
On Wed, Mar 4, 2015 at 2:32 PM, Jason Moore <moorepants@...287...> wrote:
Thanks Nicolas for your code.
The difference in what I have and what you share is in the svg path specification. For some reason Inkscape outputs a single leading "c" for the bezier curve in my path whereas your path has a "c" for every three points. I'm not quite sure the difference, maybe Inkscape outputs a non-standard form.
Jason
moorepants.info
+01 530-601-9791
On Wed, Mar 4, 2015 at 1:53 PM, Nicolas P. Rougier <Nicolas.Rougier@...3729...82...> wrote:
Here is a (limited) SVG path parser I made some time ago:
https://github.com/rougier/LinuxMag-HS-2014/blob/master/matplotlib/firefox.py
The svg_parse function might just do what you're trying to achieve.
Nicolas
> On 04 Mar 2015, at 20:51, Jason Moore <moorepants@...287...> wrote:
>
> Hi,
>
> I have some SVGs with closed Bezier curve paths that I'd like to convert to matplotlib paths.
>
> For example, here is some code: https://gist.github.com/moorepants/4cac02e798446bb46de7
>
> The above script runs but the resulting path in matplotlib is less smooth that when opened in inkscape, for example. I've attached screenshots.
>
> I'm not sure why there is a difference.
>
> Any suggestions to get my matplotlib curves looking as smooth as they do in SVG format?
>
> Jason
> moorepants.info
> +01 530-601-9791
> <Selection_057.png><Selection_058.png>------------------------------------------------------------------------------
> Dive into the World of Parallel Programming The Go Parallel Website, sponsored
> by Intel and developed in partnership with Slashdot Media, is your hub for all
> things parallel software development, from weekly thought leadership blogs to
> news, videos, case studies, tutorials and more. Take a look and join the
> conversation now. http://goparallel.sourceforge.net/_______________________________________________
> Matplotlib-users mailing list
> Matplotlib-users@lists.sourceforge.net
> https://lists.sourceforge.net/lists/listinfo/matplotlib-users
Ahh! Yes that is likely it. I assumed that relative dimensions were always with respect to the previous point, but they are always with respect to the previous non-control point.
Thanks!
···
On Wed, Mar 4, 2015 at 10:36 PM, Nicolas P. Rougier <Nicolas.Rougier@…3782…> wrote:
Actually, both syntax are valid.
I think the problem in you svg parser is that you’re changing the reference point each time you iterate in points.
For example consider the path:
m 100,200 c 100,100 400,100 400,200 z => (m P0 c P1 P2 P3 z)
Your parser ended with vertex at (100.0, -200.0), (200.0, -300.0), (600.0, -400.0), (1000.0, -600.0)
which corresponds to [P0, P0+P1, P1+P2, P2+P3] but you want [P0, P0+P1, P0+P2, P0+P3]
Nicolas
On 05 Mar 2015, at 00:35, Jason Moore <moorepants@…287…> wrote:
Actually the notation I have is valid SVG path data. Your script could be modified to handle the more general forms, see:
http://www.w3.org/TR/SVG/paths.html#PathDataGeneralInformation
But this still doesn’t answer why the smoothness is different between the SVG and matploblib paths. I haven’t been able to figure that out yet.
Jason
moorepants.info
+01 530-601-9791
On Wed, Mar 4, 2015 at 2:32 PM, Jason Moore <moorepants@…287…> wrote:
Thanks Nicolas for your code.
The difference in what I have and what you share is in the svg path specification. For some reason Inkscape outputs a single leading “c” for the bezier curve in my path whereas your path has a “c” for every three points. I’m not quite sure the difference, maybe Inkscape outputs a non-standard form.
Jason
moorepants.info
+01 530-601-9791
On Wed, Mar 4, 2015 at 1:53 PM, Nicolas P. Rougier <Nicolas.Rougier@…3782…> wrote:
Here is a (limited) SVG path parser I made some time ago:
https://github.com/rougier/LinuxMag-HS-2014/blob/master/matplotlib/firefox.py
The svg_parse function might just do what you’re trying to achieve.
Nicolas
On 04 Mar 2015, at 20:51, Jason Moore <moorepants@…287…> wrote:
Hi,
I have some SVGs with closed Bezier curve paths that I’d like to convert to matplotlib paths.
For example, here is some code: https://gist.github.com/moorepants/4cac02e798446bb46de7
The above script runs but the resulting path in matplotlib is less smooth that when opened in inkscape, for example. I’ve attached screenshots.
I’m not sure why there is a difference.
Any suggestions to get my matplotlib curves looking as smooth as they do in SVG format?
Jason
moorepants.info
+01 530-601-9791
<Selection_057.png><Selection_058.png>------------------------------------------------------------------------------
Dive into the World of Parallel Programming The Go Parallel Website, sponsored
by Intel and developed in partnership with Slashdot Media, is your hub for all
things parallel software development, from weekly thought leadership blogs to
news, videos, case studies, tutorials and more. Take a look and join the
conversation now. http://goparallel.sourceforge.net/_______________________________________________
Matplotlib-users mailing list
Matplotlib-users@lists.sourceforge.net
https://lists.sourceforge.net/lists/listinfo/matplotlib-users
Jason
moorepants.info
+01 530-601-9791