Hi,
It's me again ... I still do not find my way out of the problem on how I can apply a format to the numbering of an axis. I am using the WXAgg backend and this is my code:
font = FontProperties()
self.font = font.copy()
self.font.set_size('x-small')
self.font.set_family('serif')
self.font.set_style('normal')
self.font.set_variant('normal')
self.font.set_weight('light')
<snip>and then a function plot_data:
def plot_data(self):
<snip>
a = self.fig.add_subplot(111)
a.grid(self.g)
for x,y in zip(self.active_datasets,linestyles):
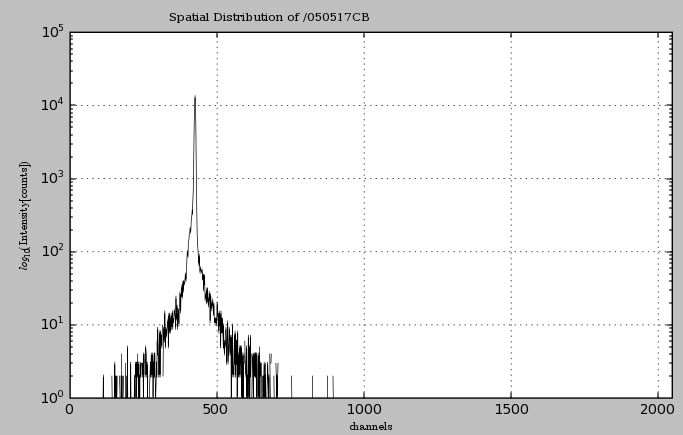
if len(self.datasets)==1: a.set_title('Spatial Distribution of %s' % x.attributes['name'], fontproperties=self.font, horizontalalignment='right')
if self.log_intensity:
a.semilogy(x.ichannel,x.intensity,'k',y)
a.set_xlim([0,len(x.ichannel)])
a.set_ylabel(r'$log_{10} \rm{(Intensity [counts])}$', fontproperties=self.font) a.set_xlabel(r'$\rm{channels}$', fontproperties=self.font)
<snip>
Now, how can I apply the font to the subplot? In order to illustrate the problem a little bit better, I attached a part of a screen shot.
Here, with just one single subplot there is actually no problem and the plot would look absolutely stunning witht the default font. But with more than one subplot in the panel there is just not enough space to display all labels and the numbering on my screen.
I guess the solution is not half as complicated than the things I've tried. But since it is not really obvious to me, I am willing to contribute an example to this topic if there is not already one. Are there guidelines on how to file examples?
Regards,
Christian