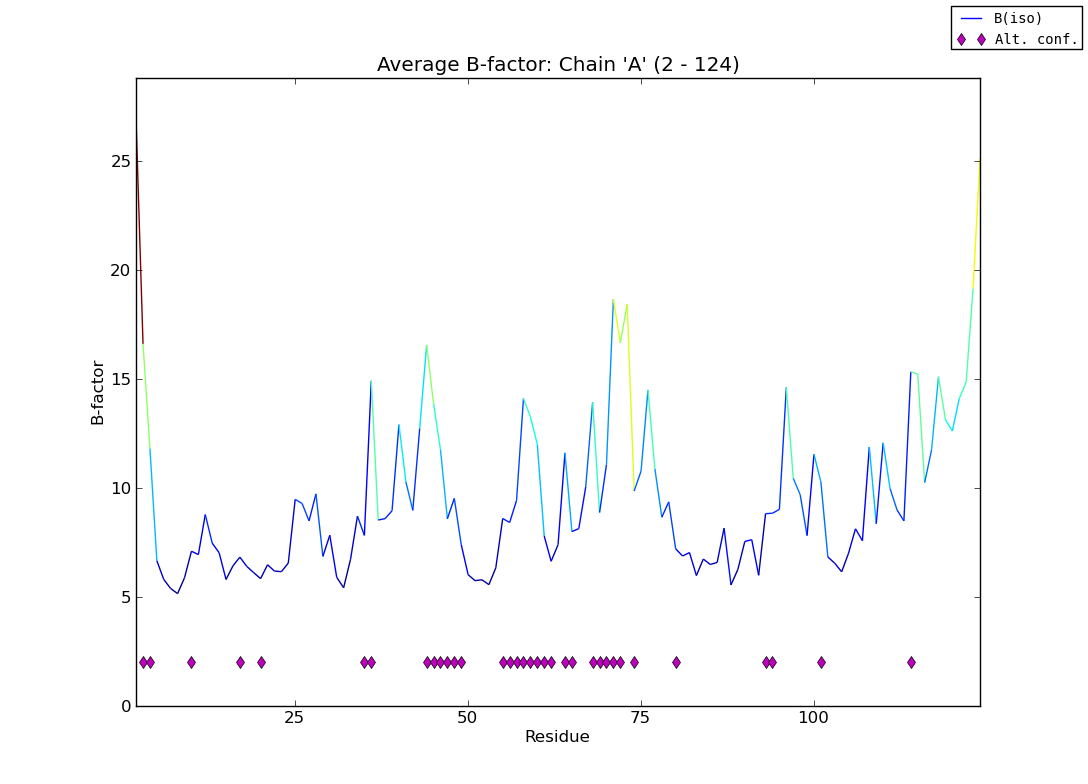
This works brilliantly, although I’m still not sure what some of these API calls do. Now a simpler problem: the color of each line depends on the starting Y value (see attached image). The effect is especially noticeable when there is a large change in value. I’d like to divide the line segments up to get a smoother color gradient, but the values are dictated by the experiment, not a mathematical function. My code is basically as follows:
y = numpy.array(avg_b)
x = numpy.linspace(1, y.size, y.size)
points = numpy.array([x, y]).T.reshape(-1,1,2)
yy = numpy.linspace(y.min(), y.max(), cm.jet.N)
norm = BoundaryNorm(yy, 256)
segments = numpy.concatenate([points[:-1], points[1:]], axis=1)
lc = LineCollection(segments, cmap=cm.jet, norm=norm)
lc.set_array(y)
p.add_collection(lc)
so I guess what I’m really asking for is a way to add intermediate X,Y values between every pair of values in ‘points’. I can do this myself in Python, but I assume that’s going to be pretty sluggish.
thanks,
Nat
···
On Thu, Mar 31, 2011 at 5:30 AM, <matplotlib-users-request@…642…ts.sourceforge.net> wrote:
On 03/30/2011 01:32 PM, Nat Echols wrote:
I wanted to display a line plot with rainbow coloring based on the
y-value, similar to what’s possible for surface plots. However, the
‘plot’ method does not appear to accept a ‘cmap’ argument. The closest
thing I was able to find was a recipe for different colored line
segments on the SciPy examples page
(http://www.scipy.org/Cookbook/Matplotlib/MulticoloredLine), but that’s
not really what I want - I was hoping for a continuous gradient over
hundreds (possibly thousands) of points on a line. Is this possible
without too much hacking?
I don’t think there is anything better than the second example here:
http://matplotlib.sourceforge.net/examples/pylab_examples/multicolored_line.html