Dear Users,
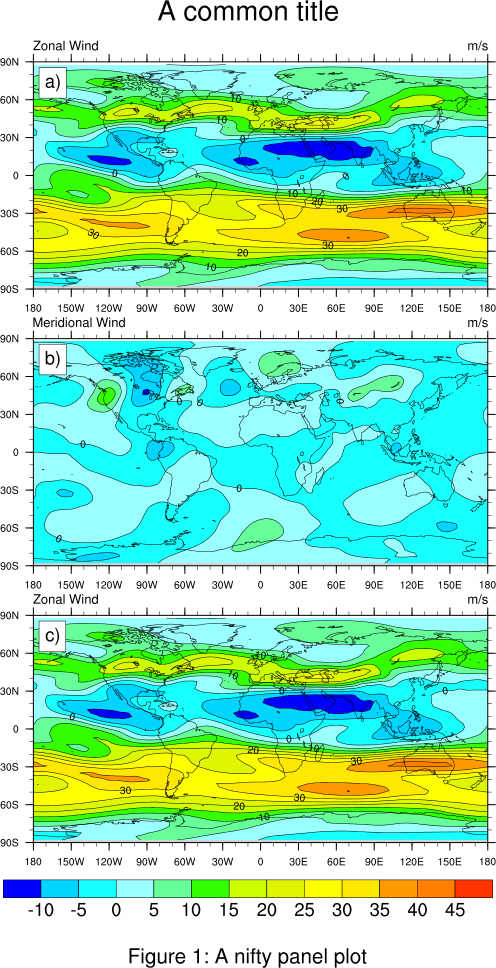
I am trying to do a subplot consist of several axes like one below. My problem is that the small figure string for each subplot (a)(b)(c), if there is any resource controlling this text, or I have to some other configurations?
Jinbo
Dear Users,
I am trying to do a subplot consist of several axes like one below. My
problem is that the small figure string for each subplot (a)(b)(c), if
there is any resource controlling this text, or I have to some other
configurations?
Jinbo
_______________________________________________
Matplotlib-users mailing list
Matplotlib-users at python.org Matplotlib-users Info Page
Hi Vincent,
Thanks, I have looked into this, and the labels works pretty fine!
yours,
Jinbo
···
-----???-----
???: "vincent.adrien at gmail.com" <vincent.adrien at gmail.com>
???: 2019-06-16 22:31:51 (???)
???: matplotlib-users at python.org
??:
??: Re: [Matplotlib-users] Any way to add figure string for subplots
Hi Jinbo,
You should be able to achieve this with `annotate`. Here is a small
snippet demonstrating its basic use:
import matplotlib.pyplot as plt
plt.ion()

fig, axs = plt.subplots(ncols=2, nrows=2)  # dummy 2x2 subplot grid

# NB: a better annotation tutorial is available at
# https://matplotlib.org/tutorials/text/annotations.html
for ax, label in zip(axs.flat, ["(a)", "(b)", "(c)", "(d)"]):
    ax.annotate(label,
                (0.02, 0.03), xycoords="axes fraction",  # coordinates
                ha="left", va="bottom",  # horiz. & vertical alignement
                weight="bold", style="italic"  # font option examples
                )
Le 16/06/2019 ? 10:47, ??? a ?crit?:
> Dear Users,
> I am trying to do a subplot consist of several axes like one below. My
> problem is that the small figure string for each subplot (a)(b)(c), if
> there is any resource controlling this text, or I have to some other
> configurations?
> Jinbo
>
>
>
>
> _______________________________________________
> Matplotlib-users mailing list
> Matplotlib-users at python.org
> Matplotlib-users Info Page
>
_______________________________________________
Matplotlib-users mailing list
Matplotlib-users at python.org Matplotlib-users Info Page
--
Dr. Jinbo Xie
State Key Laboratory of Numerical Modeling for Atmospheric Sciences and Geophysical Fluid Dynamics (LASG)
Institute of Atmospheric Physics,Chinese Academy of Sciences
e-mail: xiejinbo at mail.iap.ac.cn
Tel:86-10-8299-5419?o?