From: lee.j.joon@…287…
Date: Wed, 20 Jan 2010 12:18:42 -0500
Subject: Re: [Matplotlib-users] Annotate Behaviour - Arrows Missing
To: kurtforrester@…32…
CC: matplotlib-users@…813…ourceforge.net
Additional information that I forgot to supply was that on python
2.5/windows/matplotlib 0.98.xxx (my work machine, not accessible at the
moment for the subversion number) this worked fine and there may have been a
regression from this to the current 0.99.0 (in the ubuntu repository).
The “annotation_clip” feature is introduced in 0.99.0, and annotations
are not clipped before that version.
Again, your script works fine if I add annotation_clip parameter. So,
I’m not sure what’s going on. Can anyone else reproduce this problem?
Just in case, with the following code, do you see label “Test”? It
should be seen near where the xlabel is seen.
fig = figure()
ax=subplot(111)
ax.annotate(“Test”, (-0.1, 0.5), annotation_clip=False)
Regards,
-JJ
I do not see the text “Test” where it should be on my windows machine
running python 2.6 and matplotlib 0.99.1. On the same machine before
clipping was available (python 2.5 and matplotlib 0.98.5.3) I do see
the relevant text (after removing the relevant part from the script).
Just to summarise on my machines (2 Ubuntu Karmic and 2 Windows XP)
running matplotlib 0.99.x the annotation is clipped regardless of the
setting parsed when the annotation if the annotation xy co-ordinates
are outside of the axes visible range any direction.
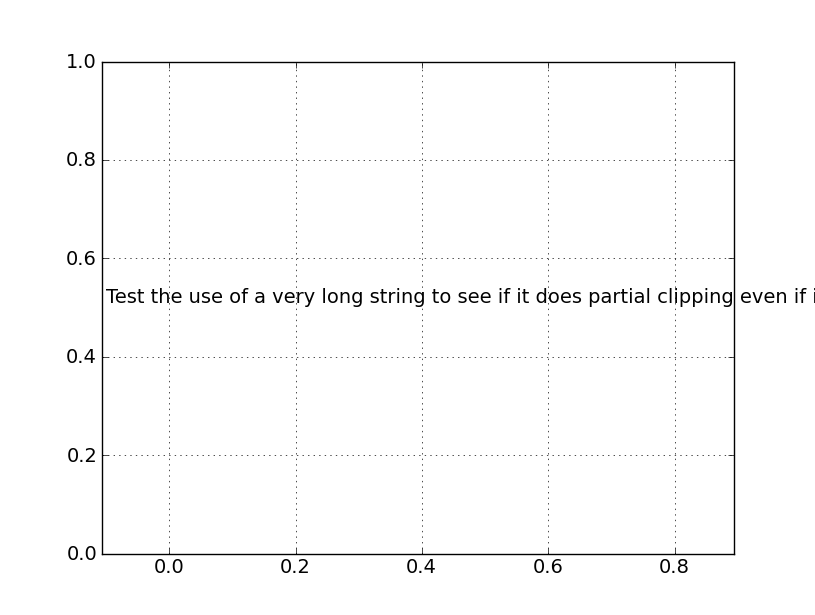
Replacing the string with a long string like “Test the use of a very
long string to see if it does partial clipping even if it passes the
full length of the x-axes” is still not visible (not any part of it)
until the beginning of the string “T” in Test is withing the positive
range of both the x and y axes.
If I pan the axes, dragging the limits so that the text moves off the
visible axes in the positive direction, the text is still visible when
it passes through the maximum value in the x direction until the xy co-ords move beyond the x-max and it is again clipped.
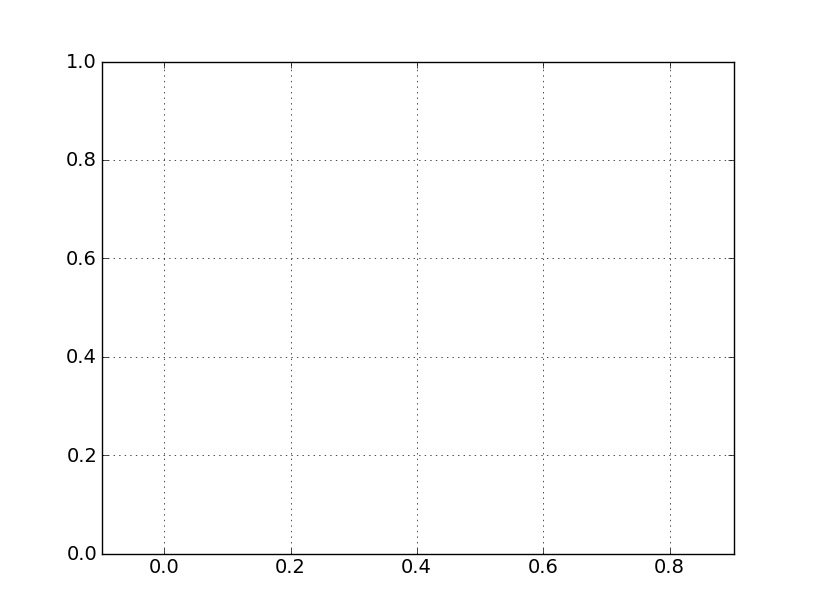
Attached are two slightly different versions of the same figure that
have been panned to demonstrate the visual differences. Note the
marginal difference in the x-axes lower limit and the text just
disappears. I would have expected the text to still be visible (that
which should be drawn in the visible axes). Just to confirm the setting
of annotation_clip=False in the script that generated the figure.
I am not too sure what the design behaviour is but it is certainly not
doing what I expected. I do appreciate your effort in resolving this.
Please do let me know if there are any further tests I can perform to
demonstrate the issue or test for fixes.
Kind Regards,
Kurt
···
On Tue, Jan 19, 2010 at 3:08 PM, Kurt Forrester > <kurtforrester@…32…> wrote:
Sell your old one fast! Time for a new car?