Animation Speed

The following is a snippet of my code for a sorting visualiser:

fig, ax = plt.subplots(figsize = (15, 7))
a_list = [i for i in range(N, 0, -1)]
bar_rects = ax.bar(range(len(a_list)), a_list, align = 'edge')

ax.set_xlim(0, N)
ax.set_ylim(0, int(1.1 * N))

def update_fig(a_list, rects):
    for rect, val in zip(rects, a_list):
        rect.set_height(val)

anim = animation.FuncAnimation(fig,
                               func = update_fig,
                               fargs = (bar_rects,),
                               frames = generator,
                               interval = 1,
                               repeat = False)

plt.show()

The algorithm works and its performance is acceptable for about 150 bars. Problem arises when the number of bars is 200 onwards - the speed of the animation drops massively. I have a feeling that updating bar heights using a for loop could be inefficient.

Is there something wrong I’m doing or something inefficient in the code? Any way to improve the animation speed?
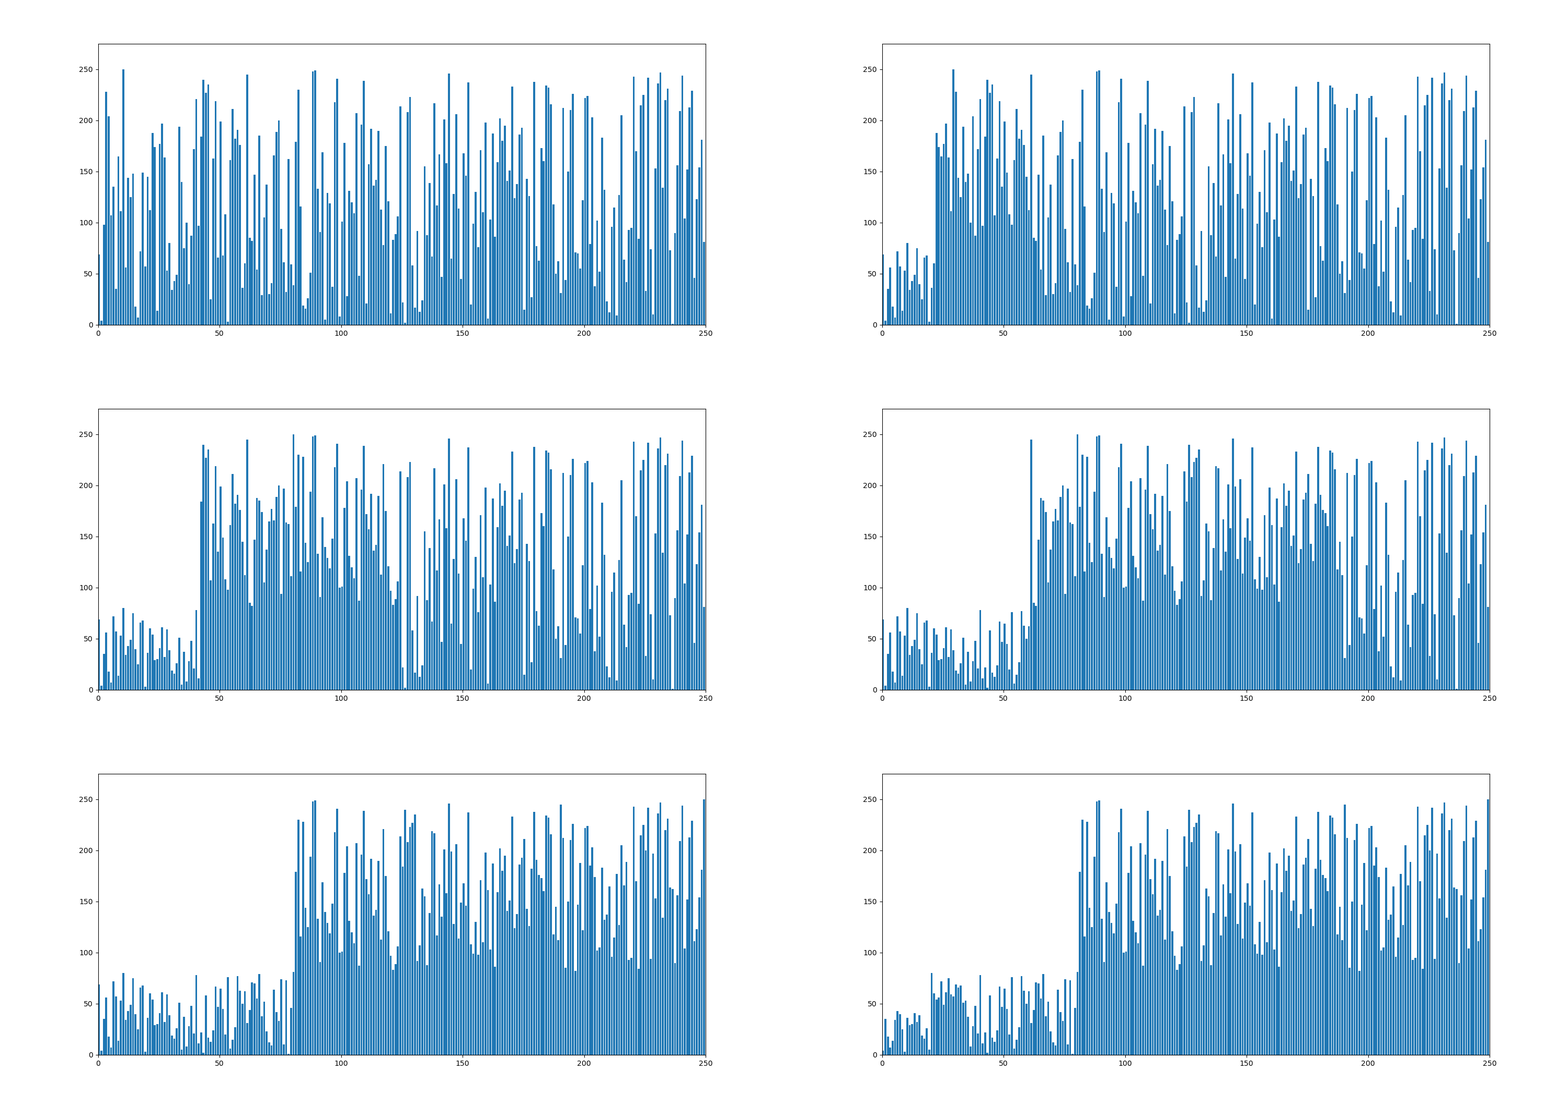
Try to put “plt.clf()” right after “def update_fig(a_list, rects):”

If you mean just before the for loop, I did it and the result is a blank plot (no bars at all). ‘plt.clf()’ is clearing the figure anyways.

Yes, also clears the memory - that sounds like your problem. I had similar time problems that using plt.clf() solved - when doing lots of frames.

If ‘plt.clf()’ results in a blank figure, what should I do?

Well I cannot see your entire code - have a look in one of mine, It might help : https://gist.github.com/Especuloide/6466d265c89be7c678ffe37f5f576dd8

Thanks, but I would like to share my code for a clearer picture:

import random
from matplotlib import pyplot    as plt
from matplotlib import animation as animation

def swap(A, i, j):
    if i != j:
        A[i], A[j] = A[j], A[i]

def quicksort(A, start, end):
    if start >= end:
        return

    pivot = A[end]
    pivotIdx = start

    for i in range(start, end):
        if A[i] < pivot:
            swap(A, i, pivotIdx)
            pivotIdx += 1
            yield A
    swap(A, end, pivotIdx)
    yield A

    yield from quicksort(A, start, pivotIdx - 1)
    yield from quicksort(A, pivotIdx + 1, end)

N = 150
a_list = [i for i in range(N, 0, -1)]
random.shuffle(a_list)

generator = quicksort(a_list, 0, N - 1)

fig, ax = plt.subplots(figsize = (15, 7))
bar_rects = ax.bar(range(len(a_list)), a_list, align = 'edge')
ax.set_xlim(0, N)
ax.set_ylim(0, int(1.1 * N))

def update_fig(a_list, rects):
    for rect, val in zip(rects, a_list):
        rect.set_height(val)

anim = animation.FuncAnimation(fig,
                               func = update_fig,
                               fargs = (bar_rects,),
                               frames = generator,
                               interval = 1,
                               repeat = False)

plt.show()

Anyway to improve the performance?

Your code gives :" NameError: name ‘A’ is not defined "

My apologies, please change the ‘A’ to ‘a_list’:

generator = quicksort(a_list, 0, N - 1)

Yes, plt.clf() will not work, because you are showing a “live” plot. Personally I do not like"live" plots - I prefer to save them as a gif file. I need to look more into your code.

Adding few lines to your code to generate a “gif” file (you must have imagemagick installed in your computer :

Sname = “C:\Users\rober\Desktop\Sorting_algo.gif” # Mind your directory
anim.save(Sname, writer=“imagemagick”, fps=18) # fps = frames per second

Should have worked, but It does not - the file is cut short (probably due to the way of your “generator” works) :
Sorting_algo

If you increase the “N” It will takes longer to process, but once you controlling the fps of the gif file the final result will not be slow.

1 Like

If we can not infer the number of frames from the input, we default to only saving 100 frame (to avoid trying to write out a file pulled from an infinite generator), see the save_count kwarg on https://matplotlib.org/api/_as_gen/matplotlib.animation.FuncAnimation.html#matplotlib-animation-funcanimation .

You are doing probably too much work (because all but 2 of the rectangles will be the same), however that is going to scale linearly with the number of bars so I would not expect there to be a change in performance.

My guess (without doing any profiling) is that when you get above 200 bars they start to be come narrower than 1 pixel and the anti-aliasing rendering costs start to kick in (but I am still a bit surprised that there is a non-linear edge).

1 Like

A faster way to render this (and avoids the aliasing / interference pattern issues with bar) is to use ax.step

import random
from matplotlib import pyplot    as plt
from matplotlib import animation as animation
import itertools
import time

def swap(A, i, j):
    if i != j:
        A[i], A[j] = A[j], A[i]

def quicksort(A, start, end):
    if start >= end:
        return

    pivot = A[end]
    pivotIdx = start

    for i in range(start, end):
        if A[i] < pivot:
            swap(A, i, pivotIdx)
            pivotIdx += 1
            yield A
    swap(A, end, pivotIdx)
    yield A

    yield from quicksort(A, start, pivotIdx - 1)
    yield from quicksort(A, pivotIdx + 1, end)

N = 250
a_list = [i for i in range(N, 0, -1)]
random.shuffle(a_list)

generator = quicksort(a_list, 0, N - 1)

fig, ax = plt.subplots(figsize = (15, 7))
ln, = ax.step(range(len(a_list)), a_list)
ax.set_xlim(0, N)
ax.set_ylim(0, int(1.1 * N))
txt = ax.annotate('', (1, 1), xytext=(-10, -10), ha='right', va='top', xycoords='axes fraction', textcoords='offset points')
j = itertools.count()
timestamps = {'last_frame': 0}
def update_fig(a_list, ln):
    cur_time = time.monotonic()
    ln.set_ydata(a_list)
    txt.set_text(str(next(j)))
    # if you want to use the rectangles leave this line as return rects + (txt,)
    return (txt, ln)


anim = animation.FuncAnimation(fig,
                               func = update_fig,
                               fargs = (ln,),
                               frames = generator,
                               interval = 1,
                               repeat = False, 
                              blit=True  # this only redraws what needs to be re-drawn
                    )
1 Like

Thank you. The ‘step’ method is indeed much faster such that the speed of N = 900 compares well with the speed of N = 300 for rect.set_height.

However for this:

# if you want to use the rectangles leave this line as return rects + (txt,)

Does this mean that I can use rectangles instead of lines for the same speed? If yes, what changes to the code do I need to introduce?

Most of the speed up is coming from it being simpler to draw 1 line with N points rather than N rectangles, but some of the speed up is coming from not having to re-render the text (that is what the blit=True enables).

If you wanted to try with the rectangles, add return rects + (txt,) to your update function (which is how you tell the animation code which artists are “animated”) and pass blit=True to FuncAnimation.

If I use ‘rects’, then my code should revert back to the original:

for rect, val in zip(rects, a_list):
        rect.set_height(val)

Right?

Yes. The update function needs to update the artists that are on the screen.

Sorry if that answers is extra pedantic, discourse would not let me post “yes” (mimimum post length 20) :wink:

Thanks. It’s OK, I know about post rules in Discourse.

As an extra, if I choose to stick back to ‘step’, the artists would be a line, but the line resembles patterns of bars. Are there tricks or hacks to make the make a vertical line all the way down, or colour filling, etc, anything that would make the ‘step’ look more bar-like?

If you want go that direction look at https://matplotlib.org/api/_as_gen/matplotlib.axes.Axes.vlines.html (and then update the resulting LineCollection (see https://matplotlib.org/_modules/matplotlib/collections.html#LineCollection.set_segments because the docstring is missing (which is something I remember writing recently, but apparently in never made it into a PR…)). The input is an iterable of (N, 2) arrays which are the (x, y) points of each line in the collection.

However, once you get to many bars it is just going to start to look solid and / or start to show Moiré patterns the width / spacing of the bars starts to be approximately a pixel.

I see. Thank you for the suggestion. I believe not much more can be squeezed from the pool of techniques in terms of performance and aesthetics.

I hope that the Matplotlib development in the near future includes improvement or solution to problems such as this.