Background:
I’m looking into modernizing some old matplotlib code that I’ve written for visualizing time-series annotations. Specifically, the problem is to accept a collection of labeled time intervals, eg something like:
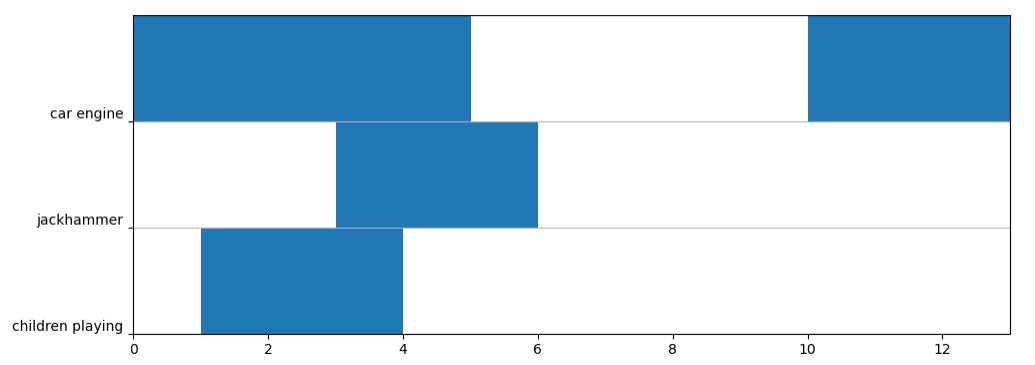
# start time, end time, label
0, 5, car engine
3, 6, jackhammer
10, 13, car engine
1, 4, children playing
and produce a corresponding plot like:
My previous implementation (src if you’re curious) works by building a numerical index for the provided label set, and then creating a BrokenBarHCollection with the time intervals as horizontal coordinates of the bars, and the label index (0, 1, 2, …) as the vertical coordinates.
This all works well enough, but it’s a bit clunky, and does not play terribly well with multiple overlapping plots because we need a way to persist the index structure. (This situation occurs often, for example, when simultaneously plotting reference annotations over the predictions from a model.)
The question:
This all got me thinking that using a categorical axis would simplify things a bit, both because the index structure becomes matplotlib’s responsibility to maintain, and because there’s an inherently persistent structure we can rely on when overlaying multiple plots.
I tried prototyping this, and ran into some snags when it came to determining the height of the (horizontal) bars. Since the vertical axis is categorical, it does not work to use a numerical value (eg, 1 or 0.75) for the height. It works if I supply the name of the second categorical string (which, I gather, maps under the hood to a position of 1), but this seems like a very incorrect way to do it. Concrete example:
fig, ax = plt.subplots()

ax.broken_barh([(0, 5-0), (10, 13-10)], ('car engine', 'jackhammer'))
ax.broken_barh([(3, 6-3), ], ('jackhammer', 'jackhammer'))
ax.broken_barh([(1, 4-1), ], ('children playing', 'jackhammer'))
produces a reasonable figure:

(comparable to the old version) but using 'jackhammer' as an indicator of “height” seems very wrong. This could be hidden from the user easily enough, I suppose by using an inverse axes transform, but the bigger issue is that there would not be an easy way to implement any other height (eg leaving vertical space between each row).
So a couple of questions:
- Is there an alternative way to set this up (still using broken barh / collections) that I’m not seeing?
- Do I need to abandon the idea of using barh collection and instead move to a more generic patch collection?
Thanks,