Hi folks,
I'm new to this list and first of all I'd like to thank all the matplotlib developers for putting together such a great package!!
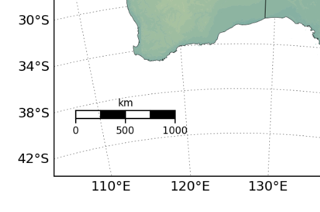
I've been using the Basemap toolkit recently and notice that the scale is generated on a zorder=0 layer.
[cid:DCC4059E-E115-401E-8A20-C35486E9B4FC@...3441...]
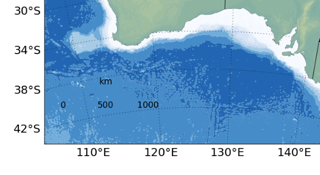
I sometimes have to stack different layers and assign them a zorder argument to play with their ranking. This can results in the masking of the scale bar:
[cid:A49D1B05-8ACA-4FEE-97B2-7179298898BA@...3441...]
As a workaround, I can set a negative zorder for the various features that could overlay the scale on the map, though.
Still, I think it would be nice to be able to have a supplementary karg added to the class.
Cheers
Gill
Dr Guillaume Duclaux
Mineral Down Under Flagship & AuScope Grid
CSIRO Earth Science and Resource Engineering
Phone: +61 8 6436 8728 | Fax: +61 8 6436 8559 | Mobile: +61 422 289 732
guillaume.duclaux@…272…<mailto:guillaume.duclaux@…272…> | www.csiro.au<http://www.csiro.au/> |
Address: Australian Resources Research Centre, 26 Dick Perry Avenue, Kensington WA 6151
PLEASE NOTE
The information contained in this email may be confidential or privileged. Any unauthorised use or disclosure is prohibited. If you have received this email in error, please delete it immediately and notify the sender by return email. Thank you. To the extent permitted by law, CSIRO does not represent, warrant and/or guarantee that the integrity of this communication has been maintained or that the communication is free of errors, virus, interception or interference.
Please consider the environment before printing this email.