Hi,
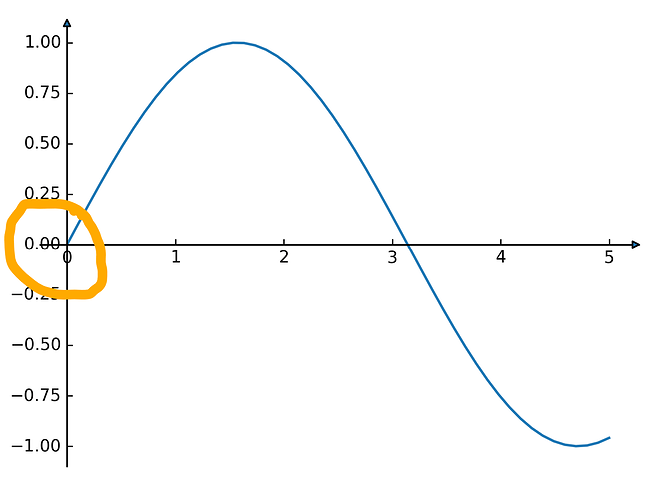
I am trying to add arrowheads to the end of my x- and y-axis. When doing so, the xaxis strikes through the 0 label tick of the yaxis, see also the attached image.
Is there a possibility that I can maybe cut down the length of the xaxis? I would rather not want to remove the ytick in any way.
Thank you very much in advance!
Code for Reproducing
import matplotlib.gridspec as gridspec
import matplotlib.pyplot as plt
import numpy as np
from mpl_toolkits.axisartist.axislines import AxesZero

nrows, ncols = 1, 1
fig = plt.figure()
gs = gridspec.GridSpec(nrows, ncols, figure=fig)
ax = fig.add_subplot(gs[0, 0], axes_class=AxesZero)

x = np.linspace(0, 5)
y = np.sin(x)
ax.plot(x, y)

for direction in ["xzero", "yzero"]:
    # adds arrows at the ends of each axis
    ax.axis[direction].set_axisline_style("-|>")

    # adds X and Y-axis from the origin
    ax.axis[direction].set_visible(True)
for direction in ["left", "right", "bottom", "top"]:
    # hides borders
    ax.axis[direction].set_visible(False)

plt.show()
Actual Outcome
Link to Github Issue
[Bug]: x-axis strikes y-axis zero · Issue #23301 · matplotlib/matplotlib (github.com)
