Add legend to figure with `tight_layout=True`

I would like to be able to add legends to the figure, making sure they don’t overlap with any of the axes. In my use case, I don’t know how many axes there are, nor if tight_layout is True or not.

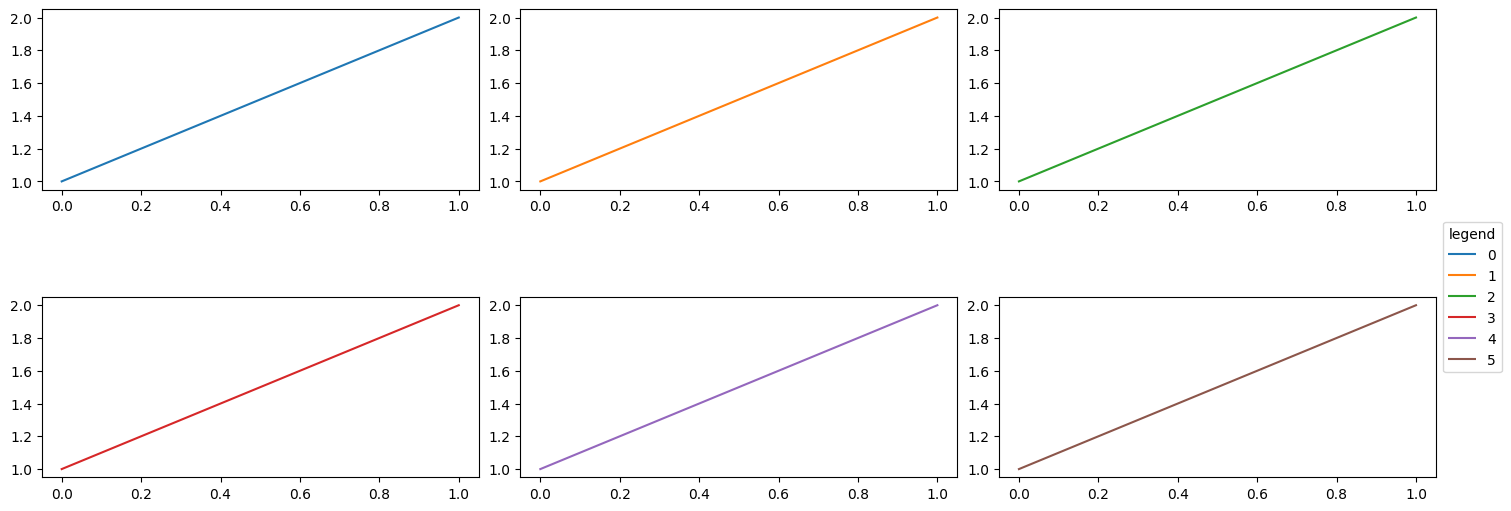
The following example allows to see the problem

import matplotlib.pyplot as plt
from matplotlib.lines import Line2D

handles = [Line2D([], [], color=f"C{i}", solid_capstyle="butt") for i in range(3)]
fig, axes = plt.subplots(1, 3, figsize=(15, 5), tight_layout=True)

for i, ax in enumerate(axes):
    ax.plot([0, 1], [1, 2], color=f"C{i}")

fig.legend(handles, ["1", "2", "3"], title="legend", bbox_to_anchor=(1, 0.5), loc="center left")
fig.savefig("plot.png")

The saved figure

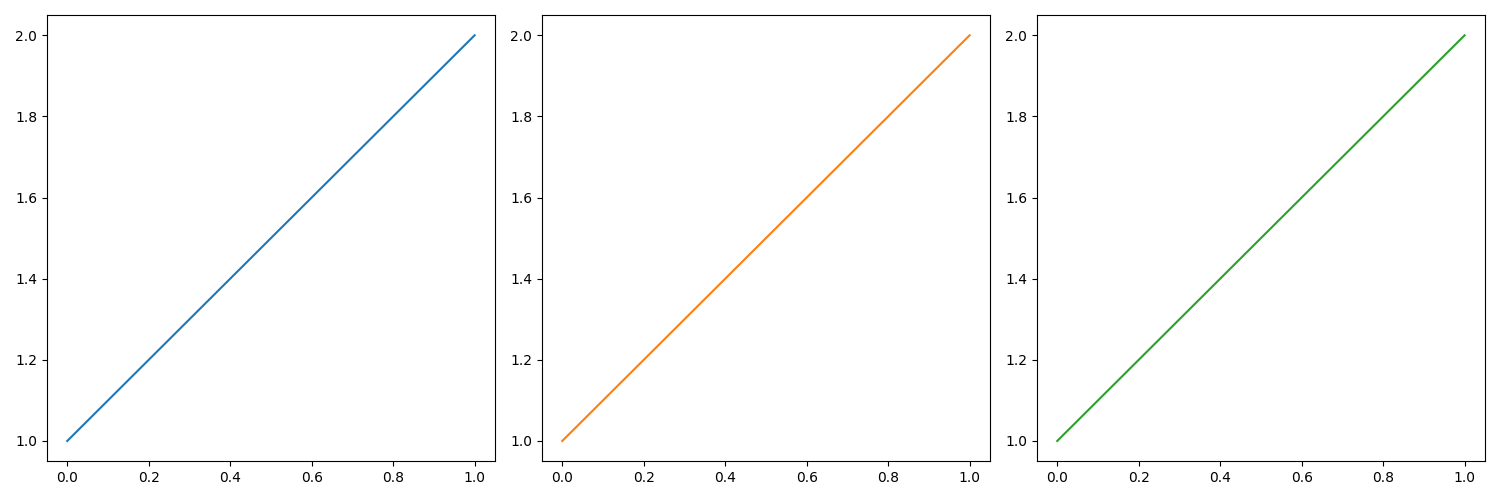
How I would like it to look like (this is how it looks like in the jupyter notebook)


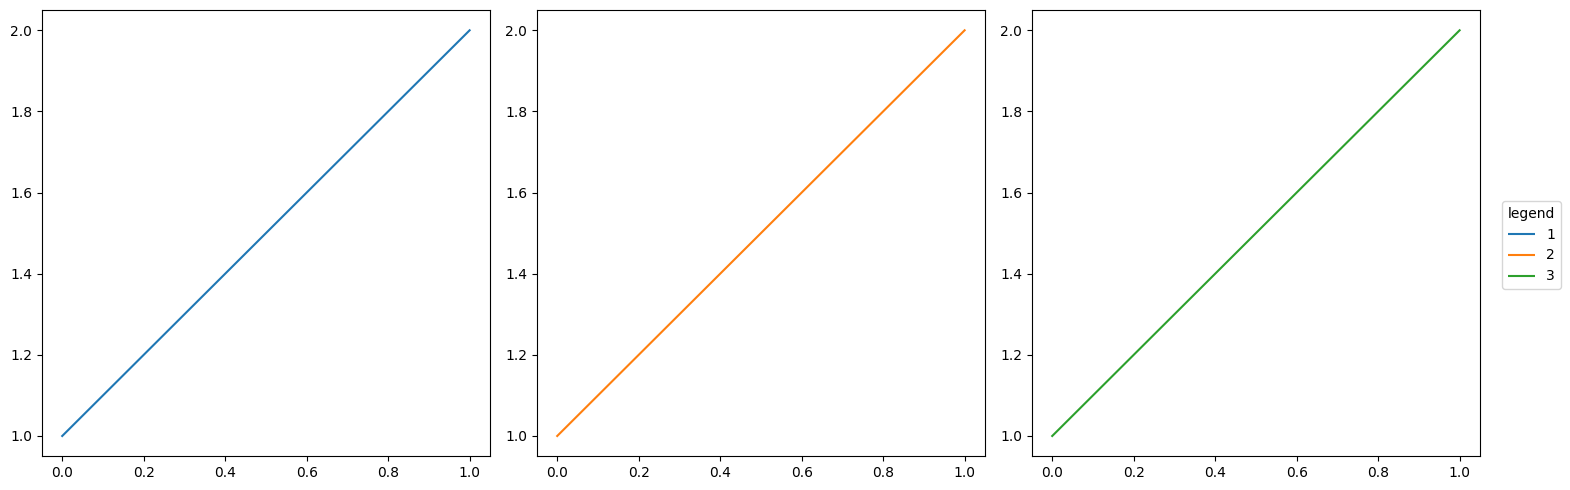
I know I could do something like

fig.subplots_adjust(left=0.05, right=0.8)
fig.legend(handles, ["1", "2", "3"], title="legend", bbox_to_anchor=(0.8, 0.5), loc="center left")

but the function I’m writing goes into a package and I don’t know if users are going to pass a figure with constrained_layout equals to True or not.

My questions are

  • Do you know if it’s possible to get legends drawn on the figure, without overlapping the axes is possible in a general way? (either with or without tight_layout active)
  • If not, do you think this will be possible in the near future?

Thanks a lot!

Matplotlib version: 3.6.2

Figure legends don’t adjust the size of axes in constrained layout. However, Axes legends do.

import matplotlib.pyplot as plt
from matplotlib.lines import Line2D

handles = [Line2D([], [], color=f"C{i}", solid_capstyle="butt") for i in range(3)]
fig, axes = plt.subplots(1, 3, figsize=(15, 5), layout='constrained')

for i, ax in enumerate(axes):
    ax.plot([0, 1], [1, 2], color=f"C{i}")

axes[-1].legend(handles, ["1", "2", "3"], title="legend", bbox_to_anchor=(1, 0.5), loc="center left")

fig.savefig("plot.png")

I don’t quite understand your question about controlling the layout manager of the figure. It seems if the user is giving you a figure, you can do what you want to it?

1 Like

Thanks a lot for taking the time to respond.

The solution you provide works for the particular case where there is 1 row and 3 columns. But I need it to work for any grid specification, that’s why I was trying to use the figure to set the location of the legend.

For example, if I have 2 rows and 3 columns I can do…

import matplotlib.pyplot as plt
from matplotlib.lines import Line2D

handles = [Line2D([], [], color=f"C{i}", solid_capstyle="butt") for i in range(6)]
fig, axes = plt.subplots(2, 3, figsize=(15, 5), layout='constrained')

for i, ax in enumerate(axes.ravel()):
    ax.plot([0, 1], [1, 2], color=f"C{i}")

axes.ravel()[-1].legend(
    handles, list(range(6)), title="legend", bbox_to_anchor=(1, 1), loc="center left"
)

fig.savefig("plot.png")

But it’s still not vertically centered in terms of the figure… What I’m looking for is something that looks like

(this is the output I get from the following code on a Jupyter Notebook, not on the saved file)

handles = [Line2D([], [], color=f"C{i}", solid_capstyle="butt") for i in range(6)]
fig, axes = plt.subplots(2, 3, figsize=(15, 5), layout='constrained')

for i, ax in enumerate(axes.ravel()):
    ax.plot([0, 1], [1, 2], color=f"C{i}")

fig.legend(handles, list(range(6)), title="legend", bbox_to_anchor=(1, 0.5), loc="center left")
fig.savefig("plot.png")

Try

fig.savefig("plot.png", bbox_inches='tight')

which is what the inline backend does internally. This will “shrink” the output to what is actually in your figure, but at the cost of losing control of the actual size of the output.

2 Likes

As @tacaswell suggests, bbox_inches='tight' should work. There are other ways to do this if you want the figure on the screen to show the legend and you are not using the inline backend. The PR in ENH: allow fig.legend outside axes... by jklymak · Pull Request #19743 · matplotlib/matplotlib · GitHub is one approach, but I’m not super interested in getting that through because I never make legends like that, and there are a lot of edge cases to worry about.

Another thing you could do is use subfigures, and put the legend in a hidden axes of a small subfigure on the right. It’s a little less automatic than #19743, but would get the idea across. But again, you seem concerned about what the user may be doing to the figure outside your control, so I’m not quite clear if that is a good solution for you.

1 Like

Thanks @tacaswell and @jklymak for your input

I may try this idea! Will see if I can make it work.