I did read the legend doc including all the examples I can find online. They all require you to define the colors before you plot. But I need to get the color after I plotted the figure.
I could maybe get the color with ax.get_legend().get_patches(), but it returns me an empty list <a list of 0 Patch objects>
Thanks for moving this here. Its indeed possible this will result in a feature or documentation request, but until that time we prefer to not have a bunch of open issues (in addition to the 1300 we have).
I understand and I also wish you guys could add this in to the GitHub issue description so that users like me will know to post here.
Back to my question, I just wanna to get the name of the color and then change the shape of it.
Right now, I’m using a pkg geopandas, and it has hard-coded legend shape. It can make quantiles maps with a cmap, so it is really annoying to create color for each quantile group (i.e. define legend color and shape before plotting). Thus, I wanna to get the color from the legend after plotting while changing the shape of the markers.
Thanks man. It seems like I can simply do: leg.legendHandles[0].get_facecolor()
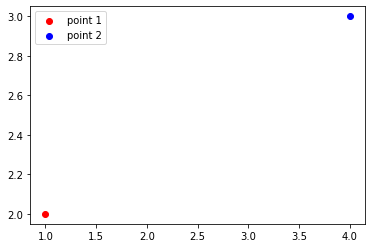
Would you mind to share the code to make the legend shape to a square or rectangle for point 1 marker with me? How would you change that after you plotted it?
I don’t know. It really depends on you guys. Should all FR be discussed at this site first and then be posted on GitHub only if the developers are interested?
I opened the issue as a FR and I still think there should be one. Since I still can’t get the color with legendHandles.
Its being discussed here a) because your request is still not clear, and b) everything that legend makes is accessible the the user somehow. It may be a bit burried, but its all there, so this is not a well-formed feature request. As the feature request template makes clear, if in doubt please discuss here first.
Does that not work for you for some reason?
I’m not sure what you mean here or what you are ultimately trying to do.
I still don’t have a good idea of why you are asking for this feature, however the use cases I can think of where I would want this it is better to start from the artists in the Axes, ask them for their properties (including color), and then work forward to create the Legend you want (rather than trying to work backwards from the legend).
rather than trying to work backwards from the legend
Indeed, as I’ve mentioned a few times before, I need to get the color after the figure being plotted. I have no control of the legend being plotted. So this is why I asked for it.
@jklymak
In terms of leg.legendHandles[0].get_facecolor(), sorry for the confusion. I tried with my use case. It doesn’t seem to work.
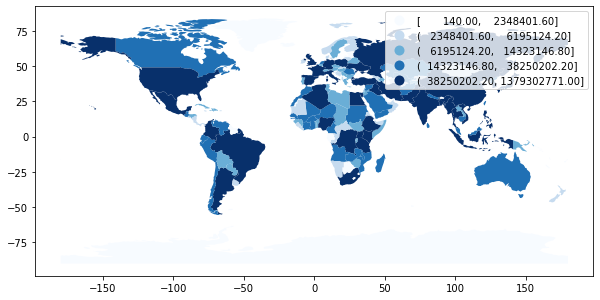
I’m using a pkg called geopandas and here’s an example:
I’d like to change the legend marker to squares or rectangles. ax.legend().legendHandles[0].get_facecolor() returns an empty list.
My understanding is that if you want to change the legend you have to define colors and labels.
I can get the labels via ax.get_legend().get_texts() but I can’t get the colors.
The colors are from a sequential cmap, so this is why I asked for this feature and need to work backwards.
If not possible, then the only way I can think about is to get each color from the cmap via the following way.
from matplotlib.colors import rgb2hex
from matplotlib.colors import ListedColormap

k = 5
cmap = plt.cm.get_cmap('Blues', k)
cmap_list = ListedColormap([rgb2hex(cmap(i)) for i in range(cmap.N)])