I followed a tutorial from [blog.paperspace.com](https://blog.paperspace.com/model-interpretability-and-understanding-for-pytorch-using-captum/) where I used Captum to visualize what my model learns. Until now it works great and I can get some visualization that makes sense.
However, I would love to add the output (plt_fig, plt_axis) of the following function to an existing subplot:
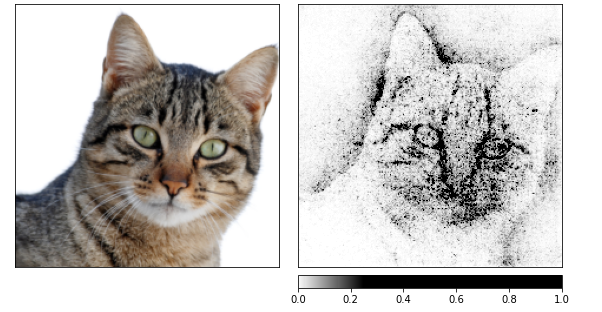
plt_fig, plt_axis = viz.visualize_image_attr_multiple(np.transpose(attributions_ig_nt.squeeze().cpu().detach().numpy(), (1,2,0)),
                                      np.transpose(transformed_img.squeeze().cpu().detach().numpy(), (1,2,0)),
                                      ["original_image", "heat_map"],
                                      ["all", "positive"],
                                      cmap=default_cmap,
                                      show_colorbar=True)
Currently the output of this function is the following image:
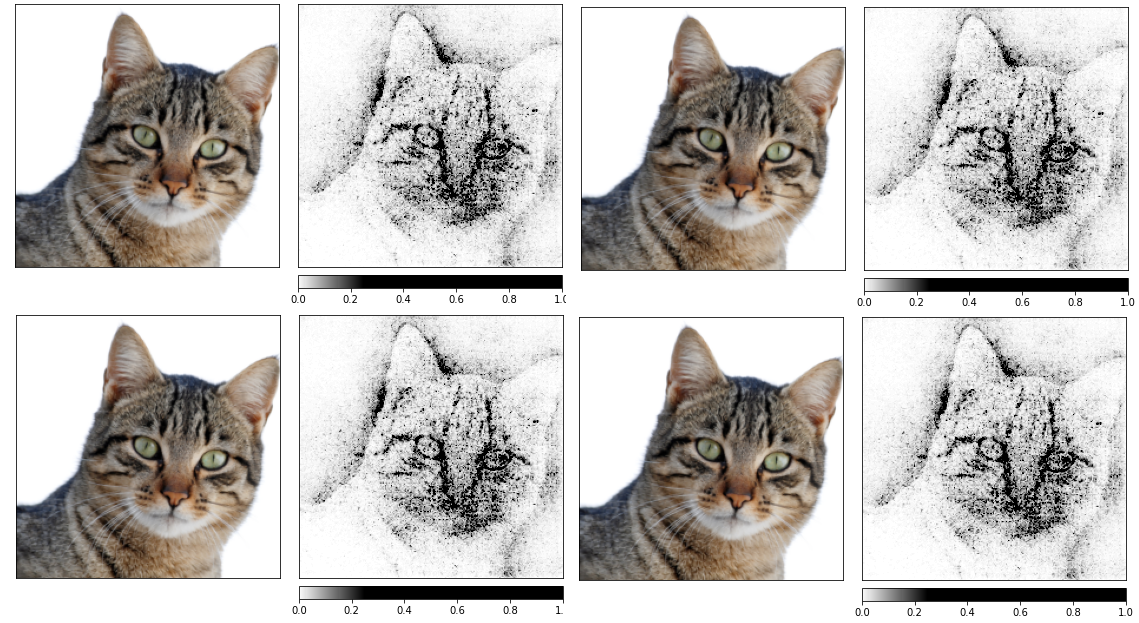
However, I would like to be able to add the subplot to an existing subplot, e.g:
Is this possible? I have tried multiple things, but none has worked until now. I am aware of that one solution is to change the source code, however, I am not very interested in that since I would like to keep the source code as it is.
Is there some other way? I even tried to save the image as png and then load it again, however, I dont like that solution ![]()
It would also be great if I could just take first image in the subplot and add it.