Hi!
I have this configuration file:
$ cat matplotlibrc
figure.figsize : 4, 3
figure.dpi : 300
savefig.dpi : 300
font.size : 9.0
and using this code
import matplotlib.pyplot as plt
plt.plot([1, 2, 3])
plt.xlabel('This is the X axis')
plt.ylabel('This is the Y axis')
plt.savefig('7900_02_06.png')
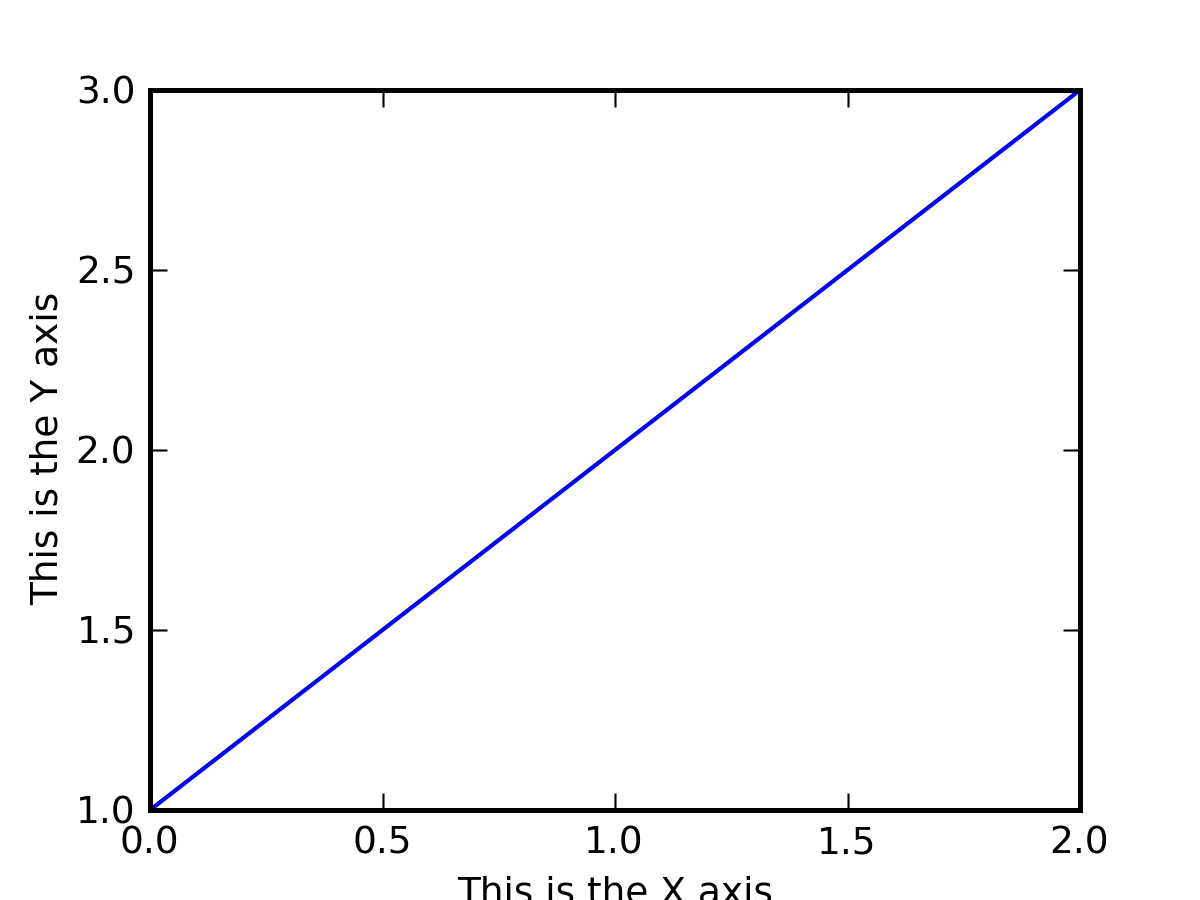
I obtain the attached image that, as you can see, has xlabel tect cut.
What is the best way to avoid it? reducing the actual "plot" area
(axes and line)? or reducing the font size?
Now that I look better at it, isn't it a bug after all? I see ylabel
correctly rendered, and xlabel not (but it's late in the night, so I
might be mistaken  ) .
) .
Thanks in advance,
···
--
Sandro Tosi (aka morph, morpheus, matrixhasu)
My website: http://matrixhasu.altervista.org/
Me at Debian: http://wiki.debian.org/SandroTosi
Sandro Tosi wrote:
Hi!
I have this configuration file:
$ cat matplotlibrc
figure.figsize : 4, 3
figure.dpi : 300
savefig.dpi : 300
font.size : 9.0
and using this code
import matplotlib.pyplot as plt
plt.plot([1, 2, 3])
plt.xlabel('This is the X axis')
plt.ylabel('This is the Y axis')
plt.savefig('7900_02_06.png')
I obtain the attached image that, as you can see, has xlabel tect cut.
What is the best way to avoid it? reducing the actual "plot" area
(axes and line)? or reducing the font size?
Now that I look better at it, isn't it a bug after all? I see ylabel
correctly rendered, and xlabel not (but it's late in the night, so I
might be mistaken ) .
It is not really a bug; it is an inherent limitation in mpl's default automatic Axes positioning. Axes positions are given in normalized coordinates relative to the figure, so if you shrink the height of the figure (relative to the default, for which the default positioning parameters are designed), there is less physical space available for the x-axis ticks, ticklabels, and label--and things can get cut off. If you are adjusting the figsize and/or the font size, then chances are you need to adjust these normalized coordinate Axes position parameters as well. Trial and error is typically needed; it can be facilitated by using the subplot adjuster widget in an interactive window (second to last button on the toolbar) to decide what looks good. Then use the figure.subplot.* entries in matplotlibrc, or call plt.subplots_adjust(bottom=0.15) (for example), or call it as a method of the figure you have just created.
For doing the interactive adjustment, you will want to use a smaller figure dpi, something to match your screen. Everything will scale correctly when you save the figure at higher dpi.
Eric
···
Thanks in advance,
------------------------------------------------------------------------
------------------------------------------------------------------------
------------------------------------------------------------------------------
Open Source Business Conference (OSBC), March 24-25, 2009, San Francisco, CA
-OSBC tackles the biggest issue in open source: Open Sourcing the Enterprise
-Strategies to boost innovation and cut costs with open source participation
-Receive a $600 discount off the registration fee with the source code: SFAD
http://p.sf.net/sfu/XcvMzF8H
------------------------------------------------------------------------
_______________________________________________
Matplotlib-users mailing list
[email protected]
matplotlib-users List Signup and Options
Hi Eric,
thanks for the reply.
It is not really a bug; it is an inherent limitation in mpl's default
automatic Axes positioning. Axes positions are given in normalized
coordinates relative to the figure, so if you shrink the height of the
figure (relative to the default, for which the default positioning
parameters are designed), there is less physical space available for the
x-axis ticks, ticklabels, and label--and things can get cut off. If you are
adjusting the figsize and/or the font size, then chances are you need to
adjust these normalized coordinate Axes position parameters as well. Trial
Oh, ok, now it's clear
and error is typically needed; it can be facilitated by using the subplot
adjuster widget in an interactive window (second to last button on the
toolbar) to decide what looks good. Then use the figure.subplot.* entries
Yeah, I used this to find 0.13 to be my number...
in matplotlibrc, or call plt.subplots_adjust(bottom=0.15) (for example), or
call it as a method of the figure you have just created.
...that I added this command and it worked.
For doing the interactive adjustment, you will want to use a smaller figure
dpi, something to match your screen. Everything will scale correctly when
you save the figure at higher dpi.
luckily, even at dpi=300, the image still fits my screen
Cheers,
···
On Sat, Feb 28, 2009 at 20:56, Eric Firing <[email protected]...> wrote:
--
Sandro Tosi (aka morph, morpheus, matrixhasu)
My website: http://matrixhasu.altervista.org/
Me at Debian: http://wiki.debian.org/SandroTosi