How to Get symmetric plotting in pylab....
i tried this code:
# -*- coding: utf-8 -*-
"""
Created on Sat Mar 10 20:33:32 2012
@author: fajar
"""
from numpy import linspace, meshgrid, array
import matplotlib.pyplot as pl
import matplotlib.ticker as tc
from scipy.integrate import odeint
# membuat vektor
u = linspace(-5,5,25)
v = linspace(-5,5,25)
U,V = meshgrid(u,v)
def fu(u,v): return 2*u-2*v
def fv(u,v): return 2*u-3*v
FU = fu(U,V)
FV = fv(U,V)
# sistem Persamaan:
def g(x,t):
y1 = 2*x[0]-1*x[1]
y2 = 1*x[0]-2*x[1]
return [y1, y2]
time = linspace(-1,-.6,100)
con = array([[1,2],[1.5,-3],[-1.5,3],[-1.5,-3]])
pl.figure()
Q = pl.quiver(U,V,FU,FV, units='height', hold=True)
#sol = odeint(g, con[0], time)
#pl.plot(sol[:,0], sol[:,1], linewidth=2.1 , color='y')
···
#
#sol = odeint(g, con[1], time)
#pl.plot(sol[:,0], sol[:,1], linewidth=2.1,color='b')
#
#sol = odeint(g, con[2], time)
#pl.plot(sol[:,0], sol[:,1], linewidth=2.1 , color='m')
#
#sol = odeint(g, con[3], time)
#pl.plot(sol[:,0], sol[:,1], linewidth=2.1 , color='r')
#
pl.autoscale(enable=True,axis='Both', tight=True)
#tc.AutoLocator()
tc.MaxNLocator(9,symmetric=True)
#pl.xlabel('u', weight='bold')
#pl.ylabel('v', weight='bold')
#pl.title('u\'=u dan v\'=-2v',weight='bold')
#pl.autoscale()z
pl.show()
---
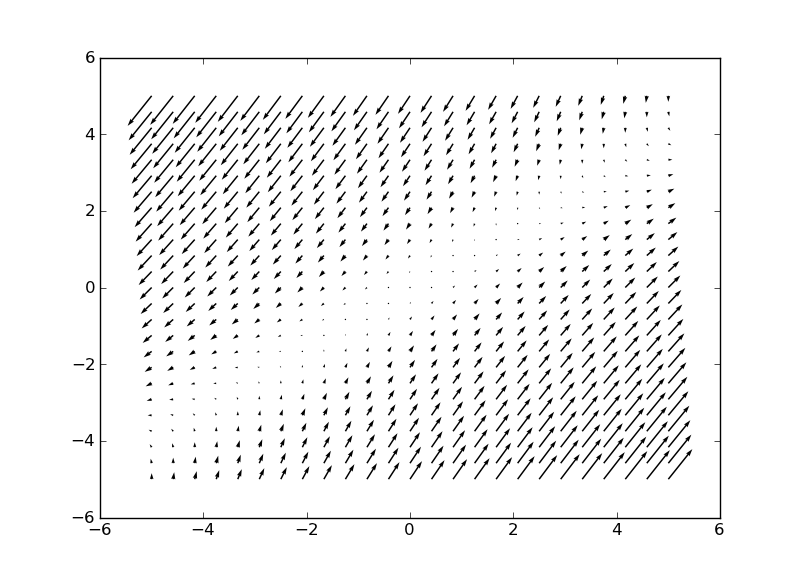
but i get picture like in this attach... (aa.png)
what i need is to Make side of figure stright... not oblique...
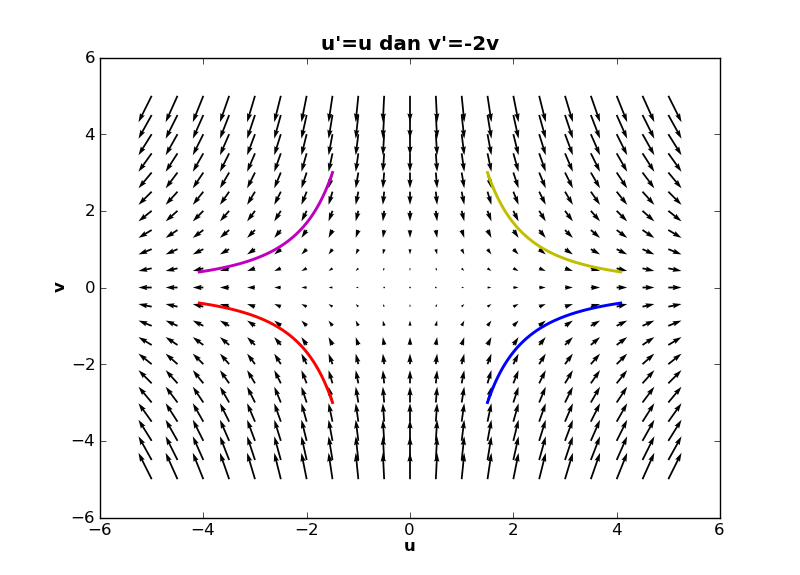
like this attach (ab.png)...
with coresponding code:
# -*- coding: utf-8 -*-
"""
Created on Sat Mar 10 20:33:32 2012
@author: fajar
"""
from numpy import linspace, meshgrid, array
import pylab as pl
from scipy.integrate import odeint
# membuat vektor
u = linspace(-5,5,21)
v = linspace(-5,5,21)
U,V = meshgrid(u,v)
def fu(u,v):return u
def fv(u,v):return -2*v
FU = fu(U,V)
FV = fv(U,V)
# sistem Persamaan:
def g(x,t):
y1 = x[0]
y2 = -2*x[1]
return [y1, y2]
time = linspace(0,1,100)
con = array([[1.5,3],[1.5,-3],[-1.5,3],[-1.5,-3]])
pl.figure()
Q = pl.quiver(U,V,FU,FV, units='height', hold=True)
sol = odeint(g, con[0], time)
pl.plot(sol[:,0], sol[:,1], linewidth=2.1 , color='y')
sol = odeint(g, con[1], time)
pl.plot(sol[:,0], sol[:,1], linewidth=2.1,color='b')
sol = odeint(g, con[2], time)
pl.plot(sol[:,0], sol[:,1], linewidth=2.1 , color='m')
sol = odeint(g, con[3], time)
pl.plot(sol[:,0], sol[:,1], linewidth=2.1 , color='r')
pl.autoscale(enable=True,axis='Both', tight =True)
pl.xlabel('u', weight='bold')
pl.ylabel('v', weight='bold')
pl.title('u\'=u dan v\'=-2v',weight='bold')
pl.show()
--
i'm sorry, i didn't well to speak english, but i guess you know what mean... thanks before.... 