Dear ALL,
Enclosed is an sample application I put together (partially using
wxGlade) that is a first attempt at providing a working example of a
GUI frontend with wxPython and Matplotlib/Basemap.
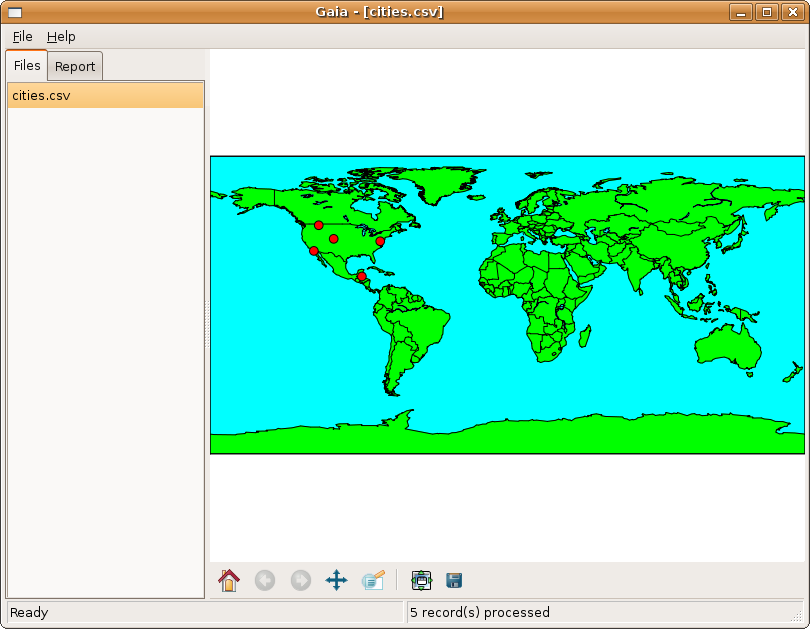
The application consists of two panels, separated by a splitter. The
left panel has a notebook with two pages, which have, respectively, a
listbox and a read-only multine text control. The right panel has a
figure object created at runtime, to which a basemap object is
attached.
The application reads comma-delimited data files of geographic
coordinates (in decimal format) selected by the user, appending them
to the listbox. When a file is selected on the list, the points are
plotted on the basemap displayed in the panel to the right.
Well, at least it should! It turns out that the map is correctly
displayed, but it then fills almost the whole parent window,
overlapping the left panel where the notebook with the listbox and the
text control should appear! This illustrates one of the worst (in my
opinion) things about wxPython, that is the handling of "sizers" to
correctly place the widgets on an application window.
I have commented the parts of the code where the map is created, so
that one can see clearly what happens with and without the map plot.
Just uncomment these parts to see the map displayed (with a toolbar
properly placed, at least under Linux).
If someone can help me with this, this sample application could
provide a useful skeleton to build programs which integrate
Matplotlib/Basemap with wxPython (incidentally, this sample
application bears a very slight resemblance to Google Earth... :)). I
am, of course, donating it to the community.
Thanks in advance!
With best regards,
Gaia.py (6.93 KB)
cities.csv (179 Bytes)
···
--
Dr. Mauro J. Cavalcanti
Ecoinformatics Studio
P.O. Box 46521, CEP 20551-970
Rio de Janeiro, RJ, BRASIL
E-mail: [email protected]...
Web: http://studio.infobio.net
Linux Registered User #473524 * Ubuntu User #22717
"Life is complex. It consists of real and imaginary parts."