Hi all,
I recently designed a visualization of Matplotlib’s issues list metrics.
I quickly realised that it was worth turning this into an open source command line tool that allows you to apply it to any public project committed to Github and any time period of interest. You can download the python codebase for this tool and find a brief user guide with some examples here:
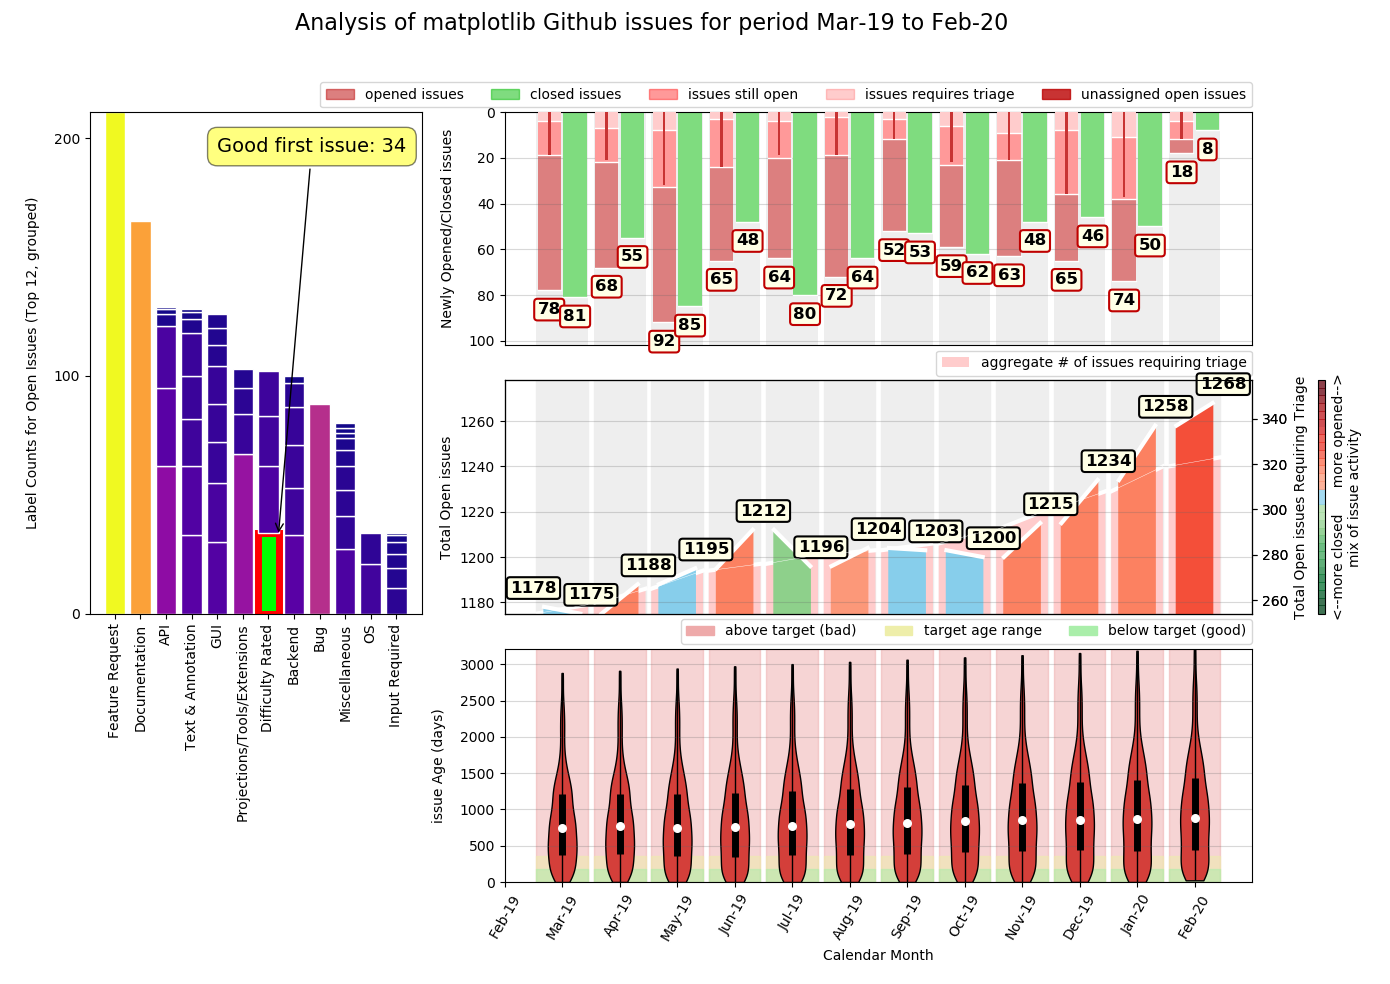
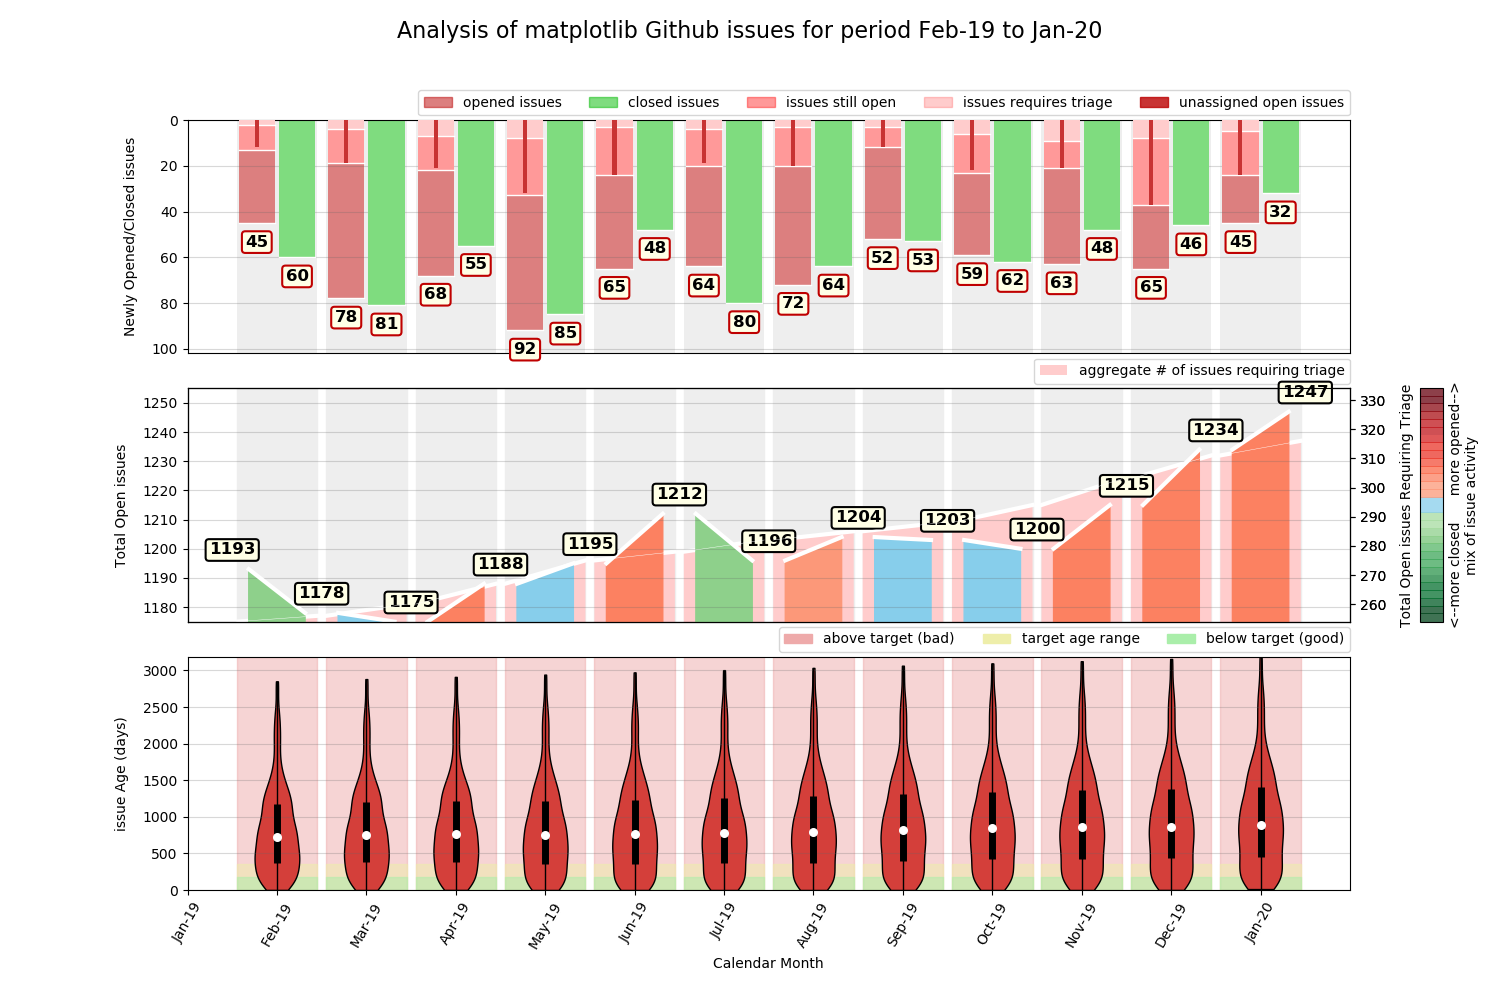
RepoDash - performance metrics for Github repositories
Here’s some example output showing the last 12 months performance for the Matplotlib issues list:
Feedback welcome.
Laurence