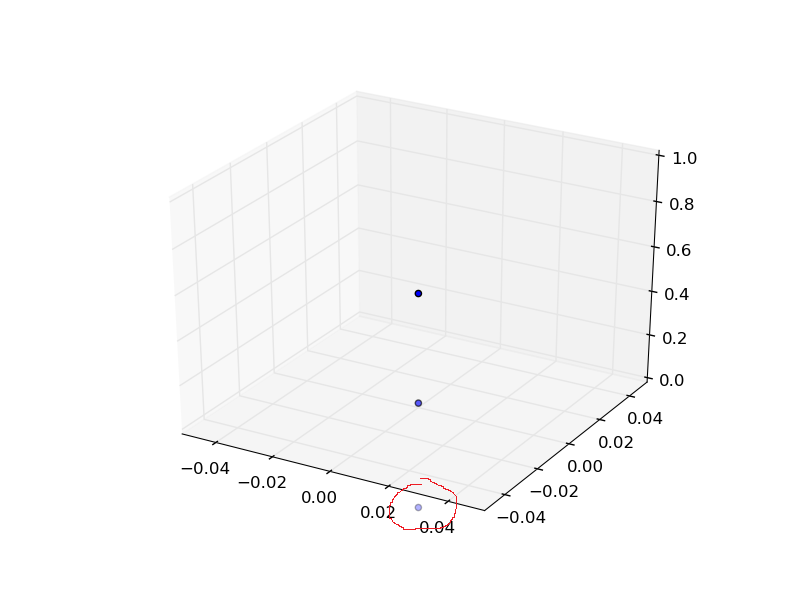
When plotting a 3D plot, it is possible to have any points that are outside the axis limits, not drawn? Basically, the same behavior as 2D plots.
Sample script and image attached. In the sample, I don’t want to see the z = -0.5 point.
This is in an interactive application where the user sets the limits, so I can’t just filter the data before passing it to ax.scatter(), or at least I think I can’t.
mpl 1.1.1
mplot3d_extent.py (285 Bytes)
···
–
Daniel Hyams
dhyams@…287…
Unfortunately, it isn’t very easy to solve this problem right now. The way that the 2-d plotting does this is to clip to a bbox, which is ingrained in the 2d transforms framework. With mplot3d, we no longer have a 2d bbox, nor do we have a proper 3d transforms framework to utilize. We also don’t have any point testing code to see if a particular point or line segment falls within a 3d region. I suppose one could partly mimic the behavior for points by hooking on an action for a change in limits event that would turn on/off the visibility of various artists based on the vertices and the bounds, but one would have to be careful there to distinguish between which artists belongs to the 3d axes object, and which belongs to the 2d axes object that the 3d axes is embedded within.
Sorry I couldn’t be more helpful.
Ben Root
···
On Sun, Feb 10, 2013 at 10:49 PM, Daniel Hyams <dhyams@…287…> wrote:
When plotting a 3D plot, it is possible to have any points that are outside the axis limits, not drawn? Basically, the same behavior as 2D plots.
Sample script and image attached. In the sample, I don’t want to see the z = -0.5 point.
This is in an interactive application where the user sets the limits, so I can’t just filter the data before passing it to ax.scatter(), or at least I think I can’t.
mpl 1.1.1
–
Daniel Hyams
dhyams@…287…