Hi,
I have written some code which generates 3D plots, this was inspired by
the 3D axes code posted recently. The basic idea is that 2D Artist
elements have their 'draw' method subverted to generate the projected 3D
coordinates. The plot is interactive and allows panning and tilting of
the graph by pressing and holding mouse-2.
I am new to this list, and was wondering where I should post the code
(it consists of two modules).
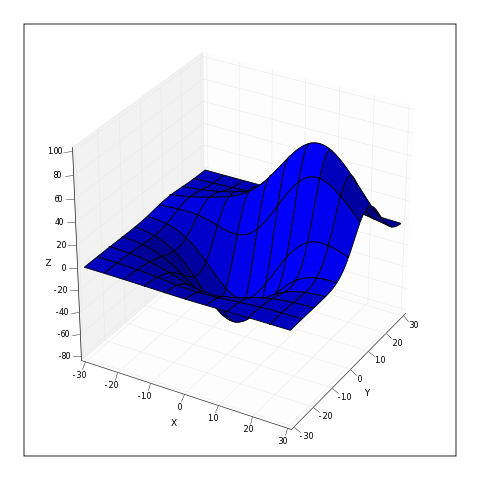
This example code here generates the attached png:
def run1():
delta = 0.025
x = y = p.arange(-3.0, 3.0, delta)
X, Y = p.meshgrid(x,y)
Z1 = p.bivariate_normal(X, Y, 1.0, 1.0, 0.0, 0.0)
Z2 = p.bivariate_normal(X, Y, 1.5, 0.5, 1, 1)
Z = Z2-Z1
X = X * 10
Y = Y * 10
Z = Z * 500
fig = p.figure()
ax = mplot3d.Axes3D(fig)
ax.plot_surface(X,Y,Z, div=10)
ax.set_xlabel('X')
ax.set_ylabel('Y')
ax.set_zlabel('Z')
fig.add_axes(ax)
p.savefig("surface.png", dpi=40)
p.show()