I have 2D data ( 4X4 matrics) and I am interested to plot it in a 3D plane.
I have found a similar post here Plot Ex
But in this example, a mesh grid is utilized which I am not sure about in the case of 2d data.
Please comment on it.
Thanks
I have 2D data ( 4X4 matrics) and I am interested to plot it in a 3D plane.
I have found a similar post here Plot Ex
But in this example, a mesh grid is utilized which I am not sure about in the case of 2d data.
Please comment on it.
Thanks
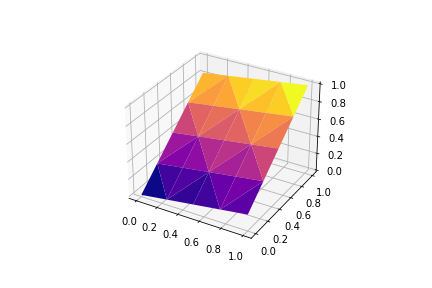
I have tried this code using trisurface plot.
from mpl_toolkits.mplot3d import axes3d
import matplotlib.pyplot as plt

import numpy as np

fig = plt.figure()
ax = fig.add_subplot(projection='3d')

# Grab some test data.
x = np.linspace(0, 1, 5)
y = np.linspace(0, 1, 5)

x1, y1 = np.meshgrid(x, y)

x1 = x1.flatten()
y1 = y1.flatten()
z = np.linspace(0,1,25)
#z = np.array((0,1, ))


ax = plt.figure().add_subplot(projection='3d')

ax.plot_trisurf(x1, y1, z, linewidth=0.2, antialiased=True, cmap = 'plasma')

plt.show()