Hi folks,
Lately I’ve been working with some data that is too copious to fit in memory, so I’ve had to write a wrapper for pyplot.hist that bins the data in chunks and then draws it like so:
pyplot.hist(x_edges, bins=100, weights=bin_contents, histtype=‘stepfilled’, facecolor=‘g’)
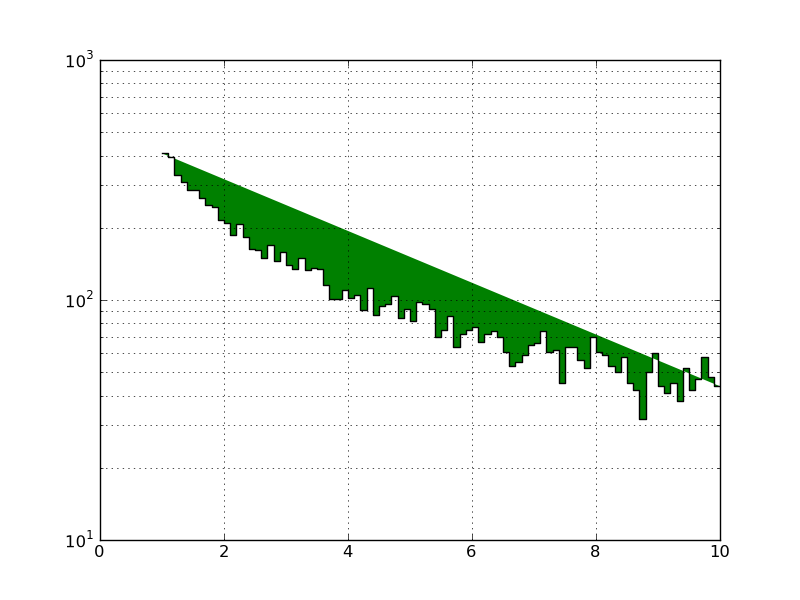
However, when I try to set the histogram’s y-scale to logarithmic the colors get all messed up (see attached). Any ideas? This is w/ matplotlib 0.99.0.
Thanks in advance.
–cb
Example script
import numpy as np
import matplotlib.pyplot as plt
generate some data on log-scale
x = 10**np.random.uniform(size=10000)
bin the data myself
bins, xed = np.histogram(x, bins=100, range=(0, 10))
plot the data as a weighted histo
plt.hist(np.linspace(0, 10, 100), bins=100, weights=bins, histtype=‘stepfilled’, facecolor=‘g’)
plt.yscale(‘log’)
plt.savefig(“test.png”)
plt.clf()
Hi folks,
Lately I’ve been working with some data that is too copious to fit in memory, so I’ve had to write a wrapper for pyplot.hist that bins the data in chunks and then draws it like so:
pyplot.hist(x_edges, bins=100, weights=bin_contents, histtype=‘stepfilled’, facecolor=‘g’)
However, when I try to set the histogram’s y-scale to logarithmic the colors get all messed up (see attached). Any ideas? This is w/ matplotlib 0.99.0.
Thanks in advance.
–cb
Example script
import numpy as np
import matplotlib.pyplot as plt
generate some data on log-scale
x = 10**np.random.uniform(size=10000)
bin the data myself
bins, xed = np.histogram(x, bins=100, range=(0, 10))
plot the data as a weighted histo
plt.hist(np.linspace(0, 10, 100), bins=100, weights=bins, histtype=‘stepfilled’, facecolor=‘g’)
plt.yscale(‘log’)
plt.savefig(“test.png”)
plt.clf()
Use log=True in the plt.hist instead of explicitly setting the in the yscale()
···
On Thu, Mar 11, 2010 at 2:41 PM, Craig the Demolishor <destroooooy@…287…> wrote:
Download Intel® Parallel Studio Eval
Try the new software tools for yourself. Speed compiling, find bugs
proactively, and fine-tune applications for parallel performance.
See why Intel Parallel Studio got high marks during beta.
http://p.sf.net/sfu/intel-sw-dev
Matplotlib-users mailing list
Matplotlib-users@lists.sourceforge.net
https://lists.sourceforge.net/lists/listinfo/matplotlib-users
–
Gökhan