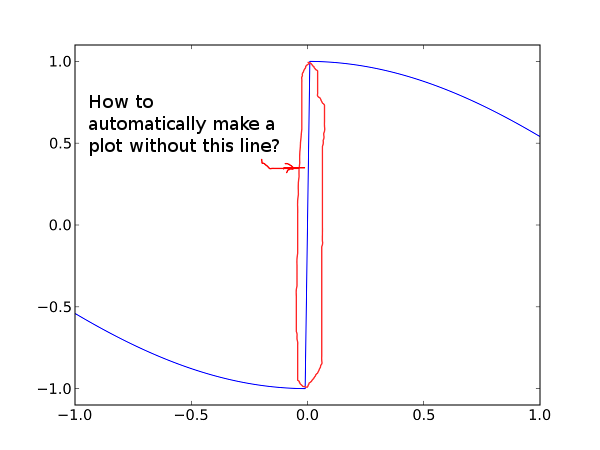
How to make a plot of a discontinuous 1d function without line at a function jump. An example is shown on a picture. This was plotted by:
import numpy
from matplotlib import pyplot
x = numpy.linspace(-1.0, 1.0, 100)
y = numpy.sign(x) * numpy.cos(x)
axes = pyplot.gca()
axes.set_ylim(-1.1, 1.1)
pyplot.plot(x, y)
idx = (x>0)
pyplot(x[idx],y[idx])
idx = numpy.logical_not(idx)
pyplot(x[idx],y[idx])
···
Le vendredi 30 septembre 2011 à 17:31 +0400, Александров Петр a écrit :
How to make a plot of a discontinuous 1d function without line at a
function jump. An example is shown on a picture. This was plotted by:
import numpy
from matplotlib import pyplot
x = numpy.linspace(-1.0, 1.0, 100)
y = numpy.sign(x) * numpy.cos(x)
axes = pyplot.gca()
axes.set_ylim(-1.1, 1.1)
pyplot.plot(x, y)
--
Fabrice Silva
Hey,
How to make a plot of a discontinuous 1d function without line at a
function jump. An example is shown on a picture. This was plotted by:
import numpy
from matplotlib import pyplot
x = numpy.linspace(-1.0, 1.0, 100)
y = numpy.sign(x) * numpy.cos(x)
axes = pyplot.gca()
axes.set_ylim(-1.1, 1.1)
pyplot.plot(x, y)
You can plot two lines, or use nan (or masked arrays I guess) to break
the line. in this case, this would be something like:
x = np.linspace(-1.0, 1.0, 101) # 101 as then 0 is included
s = np.sign(x)
s[s==0] = np.nan
y = s * np.cos(x)
plt.plot(x, y)
Regards,
Sebastian
···
On Fri, 2011-09-30 at 17:31 +0400, Александров Петр wrote:
------------------------------------------------------------------------------
All of the data generated in your IT infrastructure is seriously valuable.
Why? It contains a definitive record of application performance, security
threats, fraudulent activity, and more. Splunk takes this data and makes
sense of it. IT sense. And common sense.
http://p.sf.net/sfu/splunk-d2dcopy2
_______________________________________________ Matplotlib-users mailing list [email protected] matplotlib-users List Signup and Options
2011/9/30 Александров Петр <petr_aleksandrov@…337…>
How to make a plot of a discontinuous 1d function without line at a function jump. An example is shown on a picture. This was plotted by:
import numpy
from matplotlib import pyplot
x = numpy.linspace(-1.0, 1.0, 100)y = numpy.sign(x) * numpy.cos(x)
axes = pyplot.gca()
axes.set_ylim(-1.1, 1.1)
pyplot.plot(x, y)
If you happen to know where the discontinuity is, then you could do two separate plot commands. Automatically, it is harder. Maybe something like this would help:
threshold = 1000.0
Use gradient instead of diff because it returns an array of the same shape
dydx = numpy.gradient(y) / numpy.gradient(x)
idx = (numpy.abs(dydx) < threshold)
axes.plot(x[idx], y[idx])
Although, that gets rid of valid data points. Another trick would be to rebuild the x and y arrays, but with NaNs placed between datapoints that would form the discontinuity. matplotlib automatically treats NaNs as a indicator to break a line.
Ben Root