Hello List,
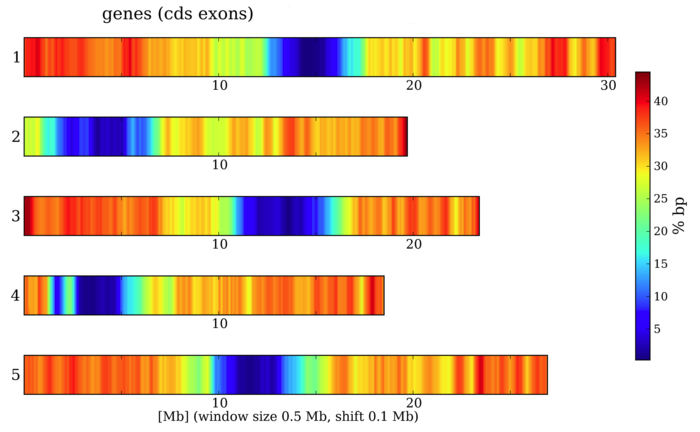
I am trying to use the pylab.contourf(X,Y,Z,100) function but I would like to mplot a 1 dimensional heatmap instead of a 2 dimensional heatmap, Perhaps “contourf” is not the solution but I do like these plots.
Any suggestions?
TIA
Hello List,
I am trying to use the pylab.contourf(X,Y,Z,100) function but I would like to mplot a 1 dimensional heatmap instead of a 2 dimensional heatmap, Perhaps “contourf” is not the solution but I do like these plots.
Any suggestions?
TIA
An example image of what you would like to see might be useful.
Ben Root
On Wed, Jul 20, 2011 at 12:15 PM, Pete Shepard <peter.shepard@…287…> wrote:
Hello List,
I am trying to use the pylab.contourf(X,Y,Z,100) function but I would like to mplot a 1 dimensional heatmap instead of a 2 dimensional heatmap, Perhaps “contourf” is not the solution but I do like these plots.
Any suggestions?
TIA
Hello List,This is a follow up to my question. trying to plot a 1D heatmap using contourf. Currently I am using pylab.contourf(X,Y,Z,100) but am wondering if this can be done in a 1d graph similar to the figures below/attached?
[
](http://mips.helmholtz-muenchen.de/plant/static/images/A_thal_LTRs.png)
[
](http://mips.helmholtz-muenchen.de/)

what are you using right now, something like that?
a = np.random.random(70)
x = np.empty([10,a.shape[0]])
x[:,:] = a
pl.contourf(x)
you might want to suppress ticks on the y-axis.
best regards, yoshi