I’ve been trying to generate certain plots, but sometimes I get strange additions to the yticks in the plots. I’ve been wondering if there is a way to force matplotlib to not do that, and only use multiplicative corrections to the plots (
i.e., just the x1e-3 for example and not the +4.519x10).
I’ve been trying to generate certain plots, but sometimes I
get strange additions to the yticks in the plots. I’ve been wondering
if there is a way to force matplotlib to not do that, and only use
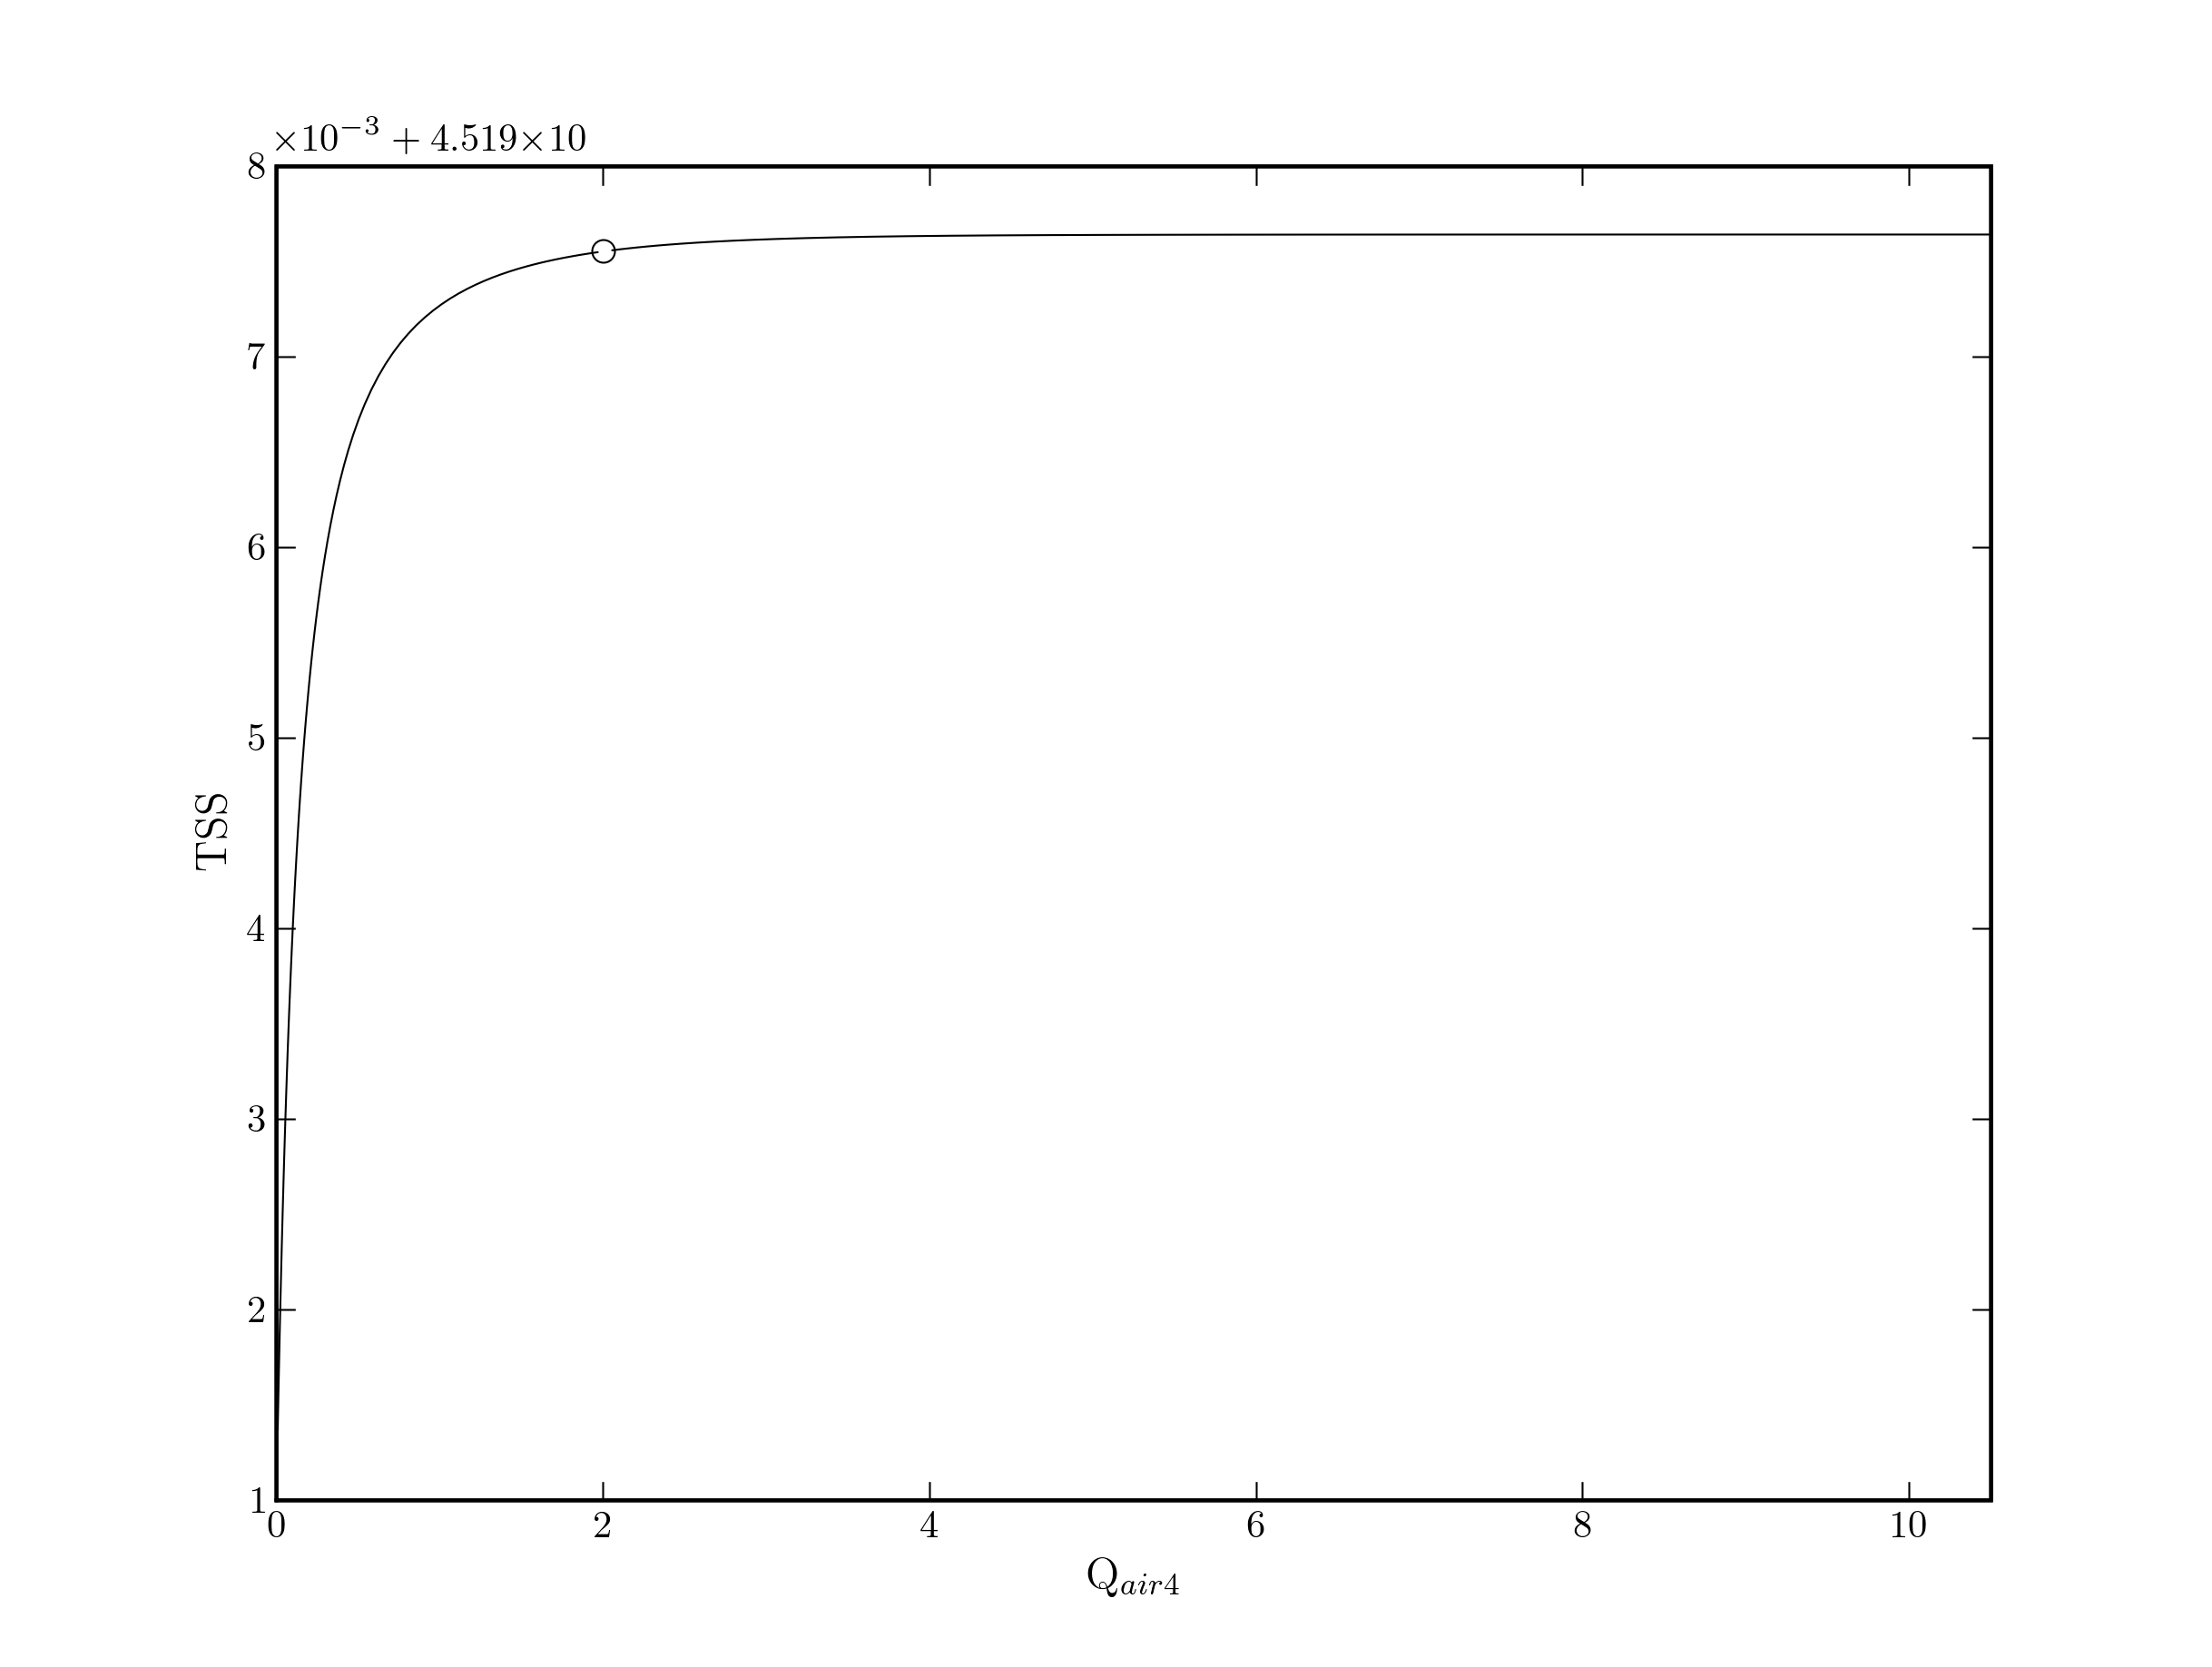
multiplicative corrections to the plots (
i.e., see picture… just the x1e-3 for example and not the +4.519x10).
Rodrigo,
This behaviour is controlled by the formatter of the yaxis. Choose one
formatter that suits you, or define your own.
More info: http://matplotlib.sourceforge.net/matplotlib.ticker.html
examples/newscalarformatter_demo.py
···
On Sunday 24 June 2007 20:45:09 Rodrigo López Negrete de la Fuente wrote:
I've been trying to generate certain plots, but sometimes I get strange
additions to the yticks in the plots. I've been wondering if there is a way
to force matplotlib to not do that, and only use multiplicative corrections
to the plots (i.e., just the x1e-3 for example and not the +4.519x10).