Wrong projection?

Hi all!
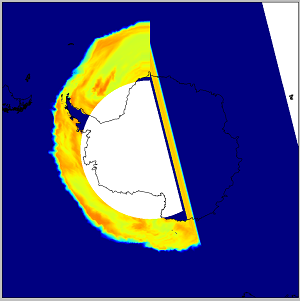
I’ve tried to plot some (sea ice thickness, snow freeboard etc.) netcdf-data on Antarctic waters but there seems to be something funny here since the plot is kind of cut in half or something.

from Scientific.IO.NetCDF import NetCDFFile # Also numpy as np, Basemap etc, matplotlib as plt.

F = NetCDFFile(‘data.nc’,‘r’)

lat = F.variables[‘nav_lat’][:,0]

lon = F.variables[‘nev_lon’][0,:]

data = np.ma.masked_where(np.isnan(F.variables[‘iice_hid’][0,2,:,:]), F.variables[‘iice_hid’][0,2,:,:])

m = Basemap(projection=‘spaeqd’,boundinglat=-50,lon_0=180,resolution=‘l’)

lons, lats = np.meshgrid(lon,lat)

fig = plt.figure()

m.pcolormesh(lons,lats,data,latlon=True,vmin=0,vmax=2.3)

m2.drawcoastlines()

plt.show()

snibetisnab.png

Unfortunately I can’t provide any data, but the dimensions are:

x=1442; y=1021; icethi(=layers)=5; time_counter=1

Longitudes are like (y,x), in degrees_east, min -180 and max 180

Latitudes are (y,x), in degrees_north, min -77, max 89

Data (the one to draw) is (time_counter,icethi,y,x).

Without meshgrid there is a RuntimeError: Buffer lengths not the same. Also I’ve tried many other projections like spstere, laea,splaea… With addcyclic the result looks exactly the same so that can’t be the problem either. The netcdf file doesn’t contain any more information about coordinate systems or projection, just that lon and lat model is in “Default grid” what ever that means. I would be very thankful if anyone can help me or give me a glue, from where to look for a solution

Cheers, Bill!

Hi Bill,

I've created a class for using the IBCAO with Basemap in the _Arctic_
that might be useful for you, it is located here:

  http://scipy-central.org/item/75/0/ibcao-international-bathymetric-chart-of-the-arctic-ocean-class-for-python-and-scipy

  ( GitHub - gauteh/ibcao_py: A matplotlib library for using the International Bathymetric Chart of the Arctic Ocean with cartopy and matplotlib )

Cheers, Gaute

Excerpts from Bill Wang's message of October 20, 2014 9:48:

···

Hi all! I've tried to plot some (sea ice thickness, snow freeboard
etc.) netcdf-data on Antarctic waters but there seems to be something
funny here since the plot is kind of cut in half or something. from
Scientific.IO.NetCDF import NetCDFFile # Also numpy as np, Basemap
etc, matplotlib as plt. F = NetCDFFile('data.nc','r')lat =
F.variables['nav_lat'][:,0]lon = F.variables['nev_lon'][0,:]data =
np.ma.masked_where(np.isnan(F.variables['iice_hid'][0,2,:,:]),
F.variables['iice_hid'][0,2,:,:])m =
Basemap(projection='spaeqd',boundinglat=-50,lon_0=180,resolution='l')lons,
lats = np.meshgrid(lon,lat)fig =
plt.figure()m.pcolormesh(lons,lats,data,latlon=True,vmin=0,vmax=2.3)m2.drawcoastlines()plt.show()

Unfortunately I can't provide any data, but the dimensions are:x=1442;
y=1021; icethi(=layers)=5; time_counter=1Longitudes are like (y,x), in
degrees_east, min -180 and max 180Latitudes are (y,x), in
degrees_north, min -77, max 89Data (the one to draw) is
(time_counter,icethi,y,x). Without meshgrid there is a RuntimeError:
Buffer lengths not the same. Also I've tried many other projections
like spstere, laea,splaea... With addcyclic the result looks exactly
the same so that can't be the problem either. The netcdf file doesn't
contain any more information about coordinate systems or projection,
just that lon and lat model is in "Default grid" what ever that means.
I would be very thankful if anyone can help me or give me a glue, from
where to look for a solution Cheers, Bill!