Dear users,
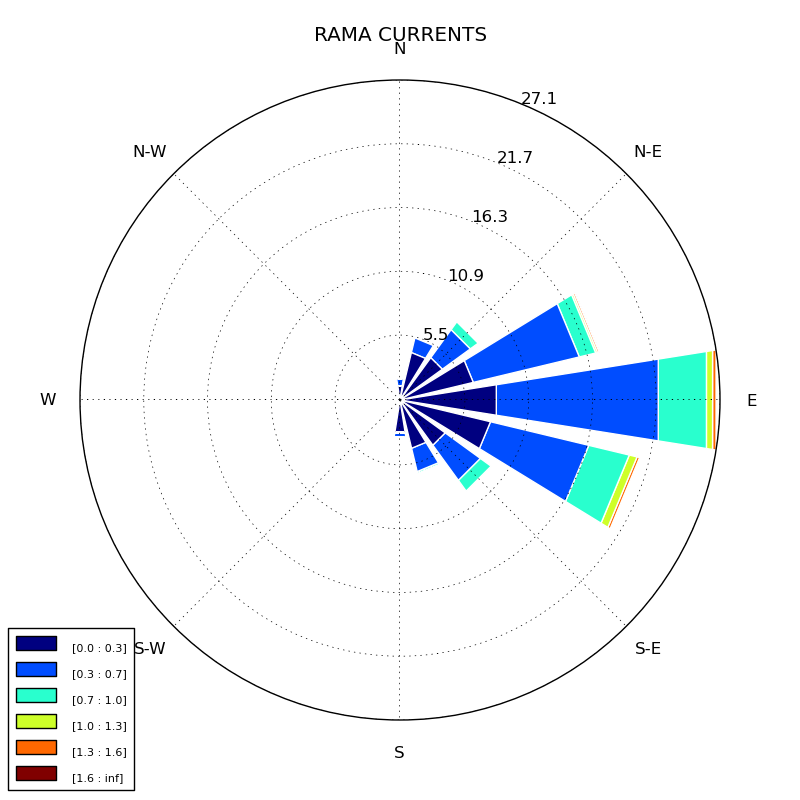
Attached is a windrose diagram created by using https://sourceforge.net/project/showfiles.php?group_id=239240&package_id=290902 . Can any one tell me if the numbers displayed in the attached plot is % of wind directions in each category? or are they represent some other numbers?
http://3.bp.blogspot.com/_4ZlrnfU7IT8/TPxpftZGzfI/AAAAAAAAADA/uq9cF3PTpR8/s1600/Wind_rose_plot.jpg
···
Sudheer Joseph
Indian National Centre for Ocean Information Services
Ministry of Earth Sciences, Govt. of India
POST BOX NO: 21, IDA Jeedeemetla P.O.
Via Pragathi Nagar,Kukatpally, Hyderabad; Pin:5000 55
Tel:+91-40-23886047(O),Fax:+91-40-23895011(O),
Tel:+91-40-23044600®,Tel:+91-40-9440832534(Mobile)
E-mail:sjo.India@…287…;sudheer.joseph@…9…
Web-
http://oppamthadathil.tripod.com
Sudheer,
That's correct. The total length of the bars is the percentage of time that
the wind is blowing *from* that direction.
See my implementation here:
https://github.com/phobson/python-metar/blob/master/metar/graphics.py#L135
Side note, you're emails are consistently formatted pretty strangely and
can be difficult to read. Perhaps stick with the same font that is in your
email signature?
···
On Tue, Mar 19, 2013 at 2:22 AM, Sudheer Joseph <sudheer.joseph@...9...>wrote:
Dear users,
Attached is a windrose diagram created by using
windrose - Browse /windrose at SourceForge.net. Can any one tell me if the numbers displayed in the attached plot is % of
wind directions in each category? or are they represent some other numbers?
http://3.bp.blogspot.com/_4ZlrnfU7IT8/TPxpftZGzfI/AAAAAAAAADA/uq9cF3PTpR8/s1600/Wind_rose_plot.jpg
Just a thought:
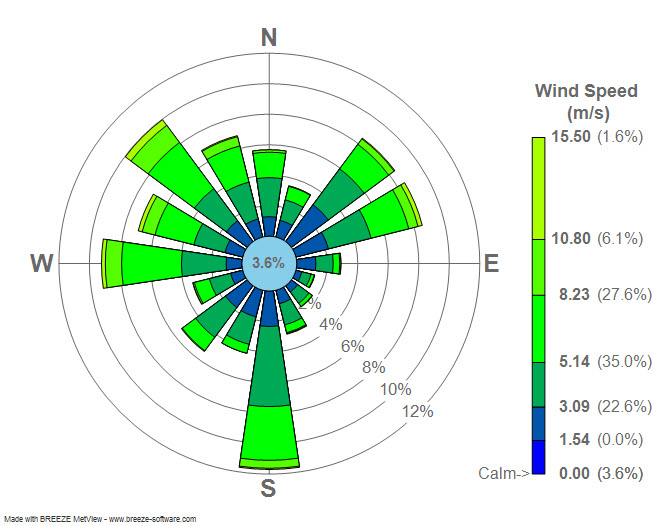
Shouldn’t the bars terminate with a arc rather then a straight line? What value should one reading this diagram look at? The one at the center of the “bar” or the “corners” these values can be quite different.
···
Dear users,
Attached is a windrose diagram created by using [https://sourceforge.net/project/showfiles.php?group_id=239240&package_id=290902](https://sourceforge.net/project/showfiles.php?group_id=239240&package_id=290902) . Can any one tell me if the numbers displayed in the attached plot is % of wind directions in each category? or are they represent some other numbers?
http://3.bp.blogspot.com/_4ZlrnfU7IT8/TPxpftZGzfI/AAAAAAAAADA/uq9cF3PTpR8/s1600/Wind_rose_plot.jpg
Sudheer,
That’s correct. The total length of the bars is the percentage of time that the wind is blowing from that direction.
See my implementation here: https://github.com/phobson/python-metar/blob/master/metar/graphics.py#L135
Side note, you’re emails are consistently formatted pretty strangely and can be difficult to read. Perhaps stick with the same font that is in your email signature?
Thank you Paul,
I think the font issue is the mischief of Yahoo. I think I should send mail in text mode rather than html then the issue will not be there I hope. The signature is in normal text mode I saved. Please revert back if my mail shows font issues again so that I can try some thing different. However when I see it in Yahoo there is no issues though…
with best regards,
Sudheer
···
Sudheer Joseph
Indian National Centre for Ocean Information Services
Ministry of Earth Sciences, Govt. of India
POST BOX NO: 21, IDA Jeedeemetla P.O.
Via Pragathi Nagar,Kukatpally, Hyderabad; Pin:5000 55
Tel:+91-40-23886047(O),Fax:+91-40-23895011(O),
Tel:+91-40-23044600(R),Tel:+91-40-9440832534(Mobile)
E-mail:sjo.India@…287…;sudheer.joseph@…9…
Web- http://oppamthadathil.tripod.com
From: Paul Hobson <pmhobson@…287…>
To: Sudheer Joseph <sudheer.joseph@…9…>
Cc: “matplotlib-users@…1739…ge.net” matplotlib-users@lists.sourceforge.net
Sent: Tuesday, 19 March 2013 11:30 PM
Subject: Re: [Matplotlib-users] windrose
On Tue, Mar 19, 2013 at 2:22 AM, Sudheer Joseph <sudheer.joseph@…9…> wrote:
Dear users,
Attached is a windrose diagram created by using [https://sourceforge.net/project/showfiles.php?group_id=239240&package_id=290902](https://sourceforge.net/project/showfiles.php?group_id=239240&package_id=290902) . Can any one tell me if the numbers displayed in the attached plot is % of wind directions in each category? or are they represent some other numbers?
http://3.bp.blogspot.com/_4ZlrnfU7IT8/TPxpftZGzfI/AAAAAAAAADA/uq9cF3PTpR8/s1600/Wind_rose_plot.jpg
Sudheer,
That’s correct. The total length of the bars is the percentage of time that the wind is blowing from that direction.
See my implementation here: https://github.com/phobson/python-metar/blob/master/metar/graphics.py#L135
Side note, you’re emails are consistently formatted pretty strangely and can be difficult to read. Perhaps stick with the same font that is in your email signature?