Why Matplotlib gui under windows 10 64 have poor performance?

Hello. When I plot some images in gui window, it have very poor performance for interactions(resize the window, zoom image, etc…). May some one help me to fix this issue?

    import matplotlib.pyplot as plt
    import matplotlib.image as img

    img = img.imread("flower.jpg")

    fig, ((axs1, axs2), (axs3, axs4)) = plt.subplots(2, 2)
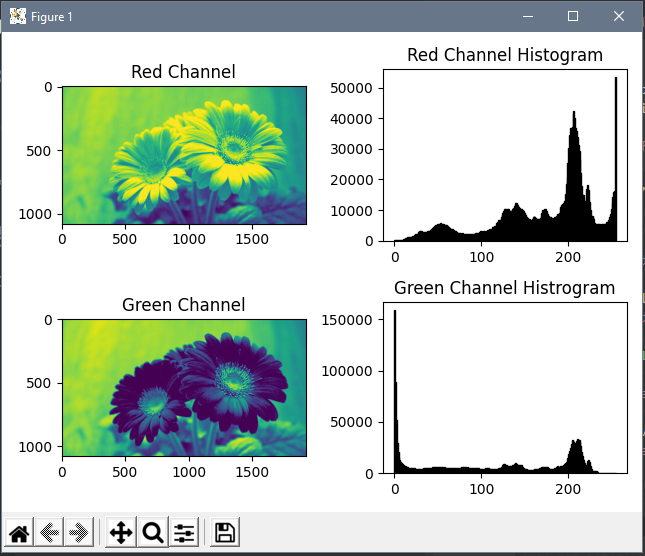
    red = img[:, :, 0]
    axs1.imshow(red)
    axs1.set_title('Red Channel')

    axs2.hist(red.ravel(), bins=256, range=(0.0, 255.0), fc='k', ec='k')
    axs2.set_title("Red Channel Histogram")

    green = img[:, :, 1]
    axs3.imshow(green)
    axs3.set_title("Green Channel")

    axs4.hist(green.ravel(), bins=256, range=(0.0, 255), fc='k', ec='k')
    axs4.set_title("Green Channel Histrogram")

    plt.tight_layout()
    plt.show()

Does in depend on the GUI backend that you are using?

Hello, its qt in backend. But I tryed gtk etc… they works very slow and do not suport too many points. Matplotlib do not use opengl for rendering?

No, we render the RBGA buffer on the CPU.

Well. Maybe its intended to work this way.

Two things to try:

  • switch to using ax.stairs (and computing the historgram your self). This will reduce the number of artists involved in the histrograms from 256 rectangles to 1 line (and our line code is pretty optimized)
  • down-sample the images. We are down sampling them for you and that may be part of the bottle neck.
1 Like