The quiver docs claim that the only api method is set_UVC and that the positions are fixed. And messing around that certainly seems to be true. Does anyone know what goes wrong when I use set_offsets on a quiver object? and in particular if there is something I could do to animate the XY positions, or something to change in the codebase to allow that.
import numpy as np
import matplotlib.pyplot as plt
fig, axs = plt.subplots(1,2)
X, Y = np.meshgrid(np.arange(0, 2 * np.pi, .2), np.arange(0, 2 * np.pi, .2))
U = np.cos(X)
V = np.sin(Y)
axs[0].quiver(X, Y, U, V, units='width')
Q = axs[1].quiver(X, Y, U, V, units='width')
# update coords
X, Y = np.meshgrid(np.arange(0, 2 * np.pi, .2)+2, np.arange(0, 2 * np.pi, .2))
U = np.cos(X)
V = np.sin(Y)
# setting all the things I can think of
Q.X = X
Q.Y = Y
Q.XY = np.column_stack([X, Y])
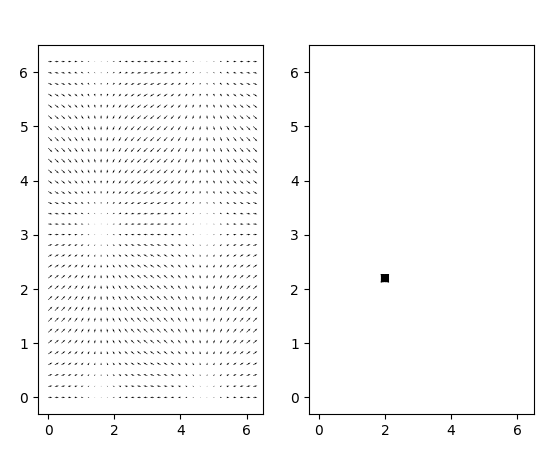
Q.set_offsets(Q.XY)
Q.set_UVC(U=U, V=V)
plt.show()
gives: