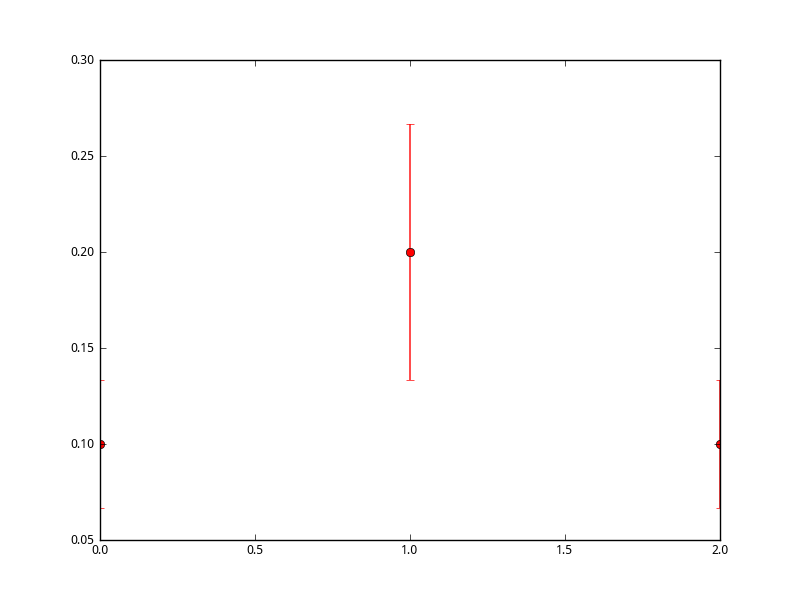
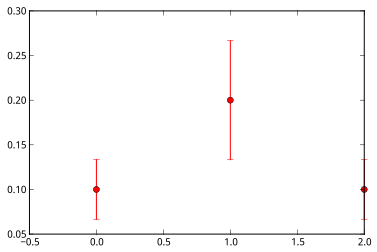
Assuming IPython in pylab mode:
a = [0.1, 0.2, 0.1]
errorbar(arange(3), a, yerr=a-sum(a)/len(a), fmt='ro')
Result MPL output clips limit values in two different ways:
- If GTK backend is used both left and right sides are clipped
- If IPyhton inline mode is used, only right side is clipped
I don’t see any obvious argument in bar(), errorbar() doc strings, that would let me define X range, although I would expect MPL to take care of this by default, based on data entered.
What is the easiest way I can correct this?
I attached images for both cases:
-
GTK:
-
Inline:
Assuming IPython in pylab mode:
a = [0.1, 0.2, 0.1]
errorbar(arange(3), a, yerr=a-sum(a)/len(a), fmt='ro')
Result MPL output clips limit values in two different ways:
- If GTK backend is used both left and right sides are clipped
- If IPyhton inline mode is used, only right side is clipped
I don’t see any obvious argument in bar(), errorbar() doc strings, that would let me define X range, although I would expect MPL to take care of this by default, based on data entered.
What is the easiest way I can correct this?
The xlim command can be used to set the x limits. For example:
xlim(-.5, 2.5)
will prevent the points lying on the axis boundaries for your case.
Angus

···
On 18 March 2012 04:39, klo uo <klonuo@…287…> wrote:
I attached images for both cases:
-
GTK:
![Inline image 2]()
-
Inline:
![Inline image 1]()
This SF email is sponsosred by:
Try Windows Azure free for 90 days Click Here
http://p.sf.net/sfu/sfd2d-msazure
Matplotlib-users mailing list
Matplotlib-users@lists.sourceforge.net
https://lists.sourceforge.net/lists/listinfo/matplotlib-users
–
AJC McMorland
Post-doctoral research fellow
Neurobiology, University of Pittsburgh
Thanks Angus,
that worked with ease for separate MPL window, but not inline in IPython.
I guess there is no setting, that will allow setting MPL to automatically adjust default plot window - add padding if bars (which can also be lines or points as in example) are drawn on axes; trim window if if there is no data to plot instead trimming based on grid range; and similar intuitive expectation
···
On Sun, Mar 18, 2012 at 1:07 PM, Angus McMorland <amcmorl@…985…> wrote:
The xlim command can be used to set the x limits. For example:
xlim(-.5, 2.5)
will prevent the points lying on the axis boundaries for your case.
The xlim command can be used to set the x limits. For example:
xlim(-.5, 2.5)
will prevent the points lying on the axis boundaries for your case.
Thanks Angus,
that worked with ease for separate MPL window, but not inline in IPython.
That's because the first command draws the plot, and when inlined,
further changes within the cell aren't propagated to the plot.
I guess there is no setting, that will allow setting MPL to automatically
adjust default plot window - add padding if bars (which can also be lines or
points as in example) are drawn on axes; trim window if if there is no data
to plot instead trimming based on grid range; and similar intuitive
expectation
For inline ipython, you want to switch to the object-oriented use of
pylab. Something like this should work with xlim.
a = [0.1, 0.2, 0.1]
fig = plt.figure()
ax = fig.add_subplot(111)
ax.errorbar(arange(3), a, yerr=a-sum(a)/len(a), fmt='ro')
ax.set_xlim(-.5,2.5)
ax.show()
I'm not aware of automatic settings for padding, but with this
set_xlim, it's easy enough to roll your own using the data limits.
Angus
···
On 18 March 2012 08:43, klo uo <klonuo@...287...> wrote:
On Sun, Mar 18, 2012 at 1:07 PM, Angus McMorland <amcmorl@...287...> wrote:
--
AJC McMorland
Post-doctoral research fellow
Neurobiology, University of Pittsburgh
OK, thanks
It’s not very elegant (assuming pylab freedom) but I take it as only way to correct clipping example (or differently put - to use custom range for axis)
···
On Sun, Mar 18, 2012 at 1:50 PM, Angus McMorland <amcmorl@…985…> wrote:
For inline ipython, you want to switch to the object-oriented use of
pylab. Something like this should work with xlim.
a = [0.1, 0.2, 0.1]
fig = plt.figure()
ax = fig.add_subplot(111)
ax.errorbar(arange(3), a, yerr=a-sum(a)/len(a), fmt=‘ro’)
ax.set_xlim(-.5,2.5)
ax.show()
I’m not aware of automatic settings for padding, but with this
set_xlim, it’s easy enough to roll your own using the data limits.
You can roll out a utility function that can automatically adjust the limits with some specified padding (i.e. the function doesn’t calculate the marker size, but you can just give it sufficient padding).
Here’s an example where you specify a padding passed on the axes size (0.05 is 5% of axes height/width):
···
On Sun, Mar 18, 2012 at 9:14 AM, klo uo <klonuo@…287…> wrote:
On Sun, Mar 18, 2012 at 1:50 PM, Angus McMorland <amcmorl@…287…> wrote:
For inline ipython, you want to switch to the object-oriented use of
pylab. Something like this should work with xlim.
a = [0.1, 0.2, 0.1]
fig = plt.figure()
ax = fig.add_subplot(111)
ax.errorbar(arange(3), a, yerr=a-sum(a)/len(a), fmt=‘ro’)
ax.set_xlim(-.5,2.5)
ax.show()
I’m not aware of automatic settings for padding, but with this
set_xlim, it’s easy enough to roll your own using the data limits.
OK, thanks
It’s not very elegant (assuming pylab freedom) but I take it as only way to correct clipping example (or differently put - to use custom range for axis)
#~~~~
import numpy as np
import matplotlib.pyplot as plt
def pad_limits(pad_frac=0.05, ax=None):
ax = ax if ax is not None else plt.gca()
ax.set_xlim(_calc_limits(ax.xaxis, pad_frac))
ax.set_ylim(_calc_limits(ax.yaxis, pad_frac))
def _calc_limits(axis, frac):
limits = axis.get_data_interval()
mag = np.diff(limits)[0]
pad = np.array([-magfrac, magfrac])
return limits + pad
a = np.array([0.1, 0.2, 0.1])
plt.errorbar(np.arange(3), a, yerr=a-sum(a)/len(a), fmt=‘ro’)
pad_limits()
plt.show()
#~~~~
I’ve put this is my personal mpl toolkit with the added ability of handling log scales:
https://github.com/tonysyu/mpltools/blob/master/mpltools/layout.py#L80
Best,
-Tony
Uhm, don’t we already have padx and pady kwargs for various limits functions? I know scatter and plot respects them.
Ben Root
···
On Sunday, March 18, 2012, Tony Yu <tsyu80@…287…> wrote:
On Sun, Mar 18, 2012 at 9:14 AM, klo uo <klonuo@…287…> wrote:
On Sun, Mar 18, 2012 at 1:50 PM, Angus McMorland <amcmorl@…287…> wrote:
For inline ipython, you want to switch to the object-oriented use of
pylab. Something like this should work with xlim.
a = [0.1, 0.2, 0.1]
fig = plt.figure()
ax = fig.add_subplot(111)
ax.errorbar(arange(3), a, yerr=a-sum(a)/len(a), fmt=‘ro’)
ax.set_xlim(-.5,2.5)
ax.show()
I’m not aware of automatic settings for padding, but with this
set_xlim, it’s easy enough to roll your own using the data limits.
OK, thanks
It’s not very elegant (assuming pylab freedom) but I take it as only way to correct clipping example (or differently put - to use custom range for axis)
You can roll out a utility function that can automatically adjust the limits with some specified padding (i.e. the function doesn’t calculate the marker size, but you can just give it sufficient padding).
Here’s an example where you specify a padding passed on the axes size (0.05 is 5% of axes height/width):
#~~~~
import numpy as np
import matplotlib.pyplot as plt
def pad_limits(pad_frac=0.05, ax=None):
ax = ax if ax is not None else plt.gca()
ax.set_xlim(_calc_limits(ax.xaxis, pad_frac))
ax.set_ylim(_calc_limits(ax.yaxis, pad_frac))
def _calc_limits(axis, frac):
limits = axis.get_data_interval()
mag = np.diff(limits)[0]
pad = np.array([-mag*frac, mag*frac])
return limits + pad
a = np.array([0.1, 0.2, 0.1])
plt.errorbar(np.arange(3), a, yerr=a-sum(a)/len(a), fmt=‘ro’)
pad_limits()
plt.show()
#~~~~
I’ve put this is my personal mpl toolkit with the added ability of handling log scales:
https://github.com/tonysyu/mpltools/blob/master/mpltools/layout.py#L80
Best,
-Tony
Oh, I didn’t know anything about them. … and where exactly? I can’t seem to find them (I looked in ax.autoscale, ax.autoscale_view, and plt.xlim).
-Tony
(Sorry for the duplicate, Ben. I forgot to reply all)
···
On Sun, Mar 18, 2012 at 11:08 AM, Benjamin Root <ben.root@…1304…> wrote:
On Sunday, March 18, 2012, Tony Yu <tsyu80@…878…287…> wrote:
On Sun, Mar 18, 2012 at 9:14 AM, klo uo <klonuo@…287…> wrote:
On Sun, Mar 18, 2012 at 1:50 PM, Angus McMorland <amcmorl@…287…> wrote:
For inline ipython, you want to switch to the object-oriented use of
pylab. Something like this should work with xlim.
a = [0.1, 0.2, 0.1]
fig = plt.figure()
ax = fig.add_subplot(111)
ax.errorbar(arange(3), a, yerr=a-sum(a)/len(a), fmt=‘ro’)
ax.set_xlim(-.5,2.5)
ax.show()
I’m not aware of automatic settings for padding, but with this
set_xlim, it’s easy enough to roll your own using the data limits.
OK, thanks
It’s not very elegant (assuming pylab freedom) but I take it as only way to correct clipping example (or differently put - to use custom range for axis)
You can roll out a utility function that can automatically adjust the limits with some specified padding (i.e. the function doesn’t calculate the marker size, but you can just give it sufficient padding).
Here’s an example where you specify a padding passed on the axes size (0.05 is 5% of axes height/width):
#~~~~
import numpy as np
import matplotlib.pyplot as plt
def pad_limits(pad_frac=0.05, ax=None):
ax = ax if ax is not None else plt.gca()
ax.set_xlim(_calc_limits(ax.xaxis, pad_frac))
ax.set_ylim(_calc_limits(ax.yaxis, pad_frac))
def _calc_limits(axis, frac):
limits = axis.get_data_interval()
mag = np.diff(limits)[0]
pad = np.array([-mag*frac, mag*frac])
return limits + pad
a = np.array([0.1, 0.2, 0.1])
plt.errorbar(np.arange(3), a, yerr=a-sum(a)/len(a), fmt=‘ro’)
pad_limits()
plt.show()
#~~~~
I’ve put this is my personal mpl toolkit with the added ability of handling log scales:
https://github.com/tonysyu/mpltools/blob/master/mpltools/layout.py#L80
Best,
-Tony
Uhm, don’t we already have padx and pady kwargs for various limits functions? I know scatter and plot respects them.
Ben Root
After parsing matplotlibrc, I browsed module where errorbars are defined (axes.py) and tried changing various variables without success.
In bar() function (line 4628) there is “adjust_xlim = False” line which calls line 4768 if set True. So I set it True, to find it’s buggy if x starts from 0 (most common start value). I didn’t tried to copy this code block in errorbars because of that
I browsed then axis.py and then - transforms.py - total mess. Retreat.
Didn’t even figured out why IPython inline mode pads left side x range in above example. Seems like IPython/core/pylabtools.py just calls “canvas.print_figure(pic-data)” and passes image in qt terminal, but I can’t reproduce same range if not in inline mode.
Idea was to learn how IPython inline mode sets one part of this range correctly, then use it to make what I wanted
So, I guess wrapping some function that would calculate smart view range, like Tony replied, is the way to go
Thanks Tony
