Hello all,
I posted about this problem on another forum (with an image attachment)
http://python-forum.org/pythonforum/viewtopic.php?f=18&t=21951&p=99290#p99290
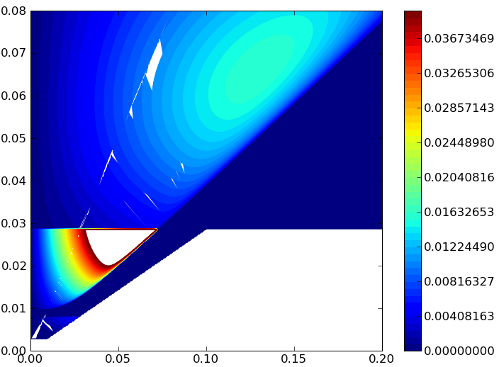
In the figure below white space that forms a trapezoid to the right
(slope then constant) and tear-shape white space to the left (due to
maxZ being too small) are expected and I have no issues with that.
The weird things are the sharp white shapes to the left. They are very
irregular and with a little different change in parameters they appear
at different places.
Below are the relevant pieces of code
Code: Select all
import matplotlib.pyplot as plt
import matplotlib.colors as colors
...
z = numpy.transpose(z)
z = numpy.ma.masked_where(z<=0, z)
levels = numpy.linspace(0,maxZ,50)
cset1=plt.contourf(x,y,z,levels,cmap=plt.get_cmap('jet',len(levels)-1))
plt.colorbar(cset1)
fname = 'pic.png'
plt.savefig(fname)
Above, z is the 2D array of values for different x and y (both lists
have 400 elements each).
Ths is really really confusing me. Any help is greatly appreciated!
Hello all,
I posted about this problem on another forum (with an image attachment)
http://python-forum.org/pythonforum/viewtopic.php?f=18&t=21951&p=99290#p99290
In the figure below white space that forms a trapezoid to the right
(slope then constant) and tear-shape white space to the left (due to
maxZ being too small) are expected and I have no issues with that.
The weird things are the sharp white shapes to the left. They are very
irregular and with a little different change in parameters they appear
at different places.
This looks like the path simplification bug that was fixed some time before mpl 1.0. You can upgrade, or as a workaround you can turn off path simplification by putting
path.simplify : False
in your matplotlibrc file, or by using
matplotlib.rcParams['path.simplify'] = False
in your script.
Eric
···
On 11/17/2010 07:35 AM, Ognjen Ilic wrote:
Below are the relevant pieces of code
Code: Select all
import matplotlib.pyplot as plt
import matplotlib.colors as colors
...
z = numpy.transpose(z)
z = numpy.ma.masked_where(z<=0, z)
levels = numpy.linspace(0,maxZ,50)
cset1=plt.contourf(x,y,z,levels,cmap=plt.get_cmap('jet',len(levels)-1))
plt.colorbar(cset1)
fname = 'pic.png'
plt.savefig(fname)
Above, z is the 2D array of values for different x and y (both lists
have 400 elements each).
Ths is really really confusing me. Any help is greatly appreciated!
------------------------------------------------------------------------------
Beautiful is writing same markup. Internet Explorer 9 supports
standards for HTML5, CSS3, SVG 1.1, ECMAScript5, and DOM L2& L3.
Spend less time writing and rewriting code and more time creating great
experiences on the web. Be a part of the beta today
http://p.sf.net/sfu/msIE9-sfdev2dev
_______________________________________________
Matplotlib-users mailing list
Matplotlib-users@lists.sourceforge.net
matplotlib-users List Signup and Options
Thanks for the help. However, when I change the matplotlibrc file I
get the following message
"Bad key "path.simplify" on line 267 in
/HOME/.matplotlib/matplotlibrc.
You probably need to get an updated matplotlibrc file from
http://matplotlib.sf.net/matplotlibrc or from the matplotlib source
distribution"
I'd do the update but I don't have root access on the server
···
On Wed, Nov 17, 2010 at 1:20 PM, Eric Firing <efiring@...202...> wrote:
On 11/17/2010 07:35 AM, Ognjen Ilic wrote:
Hello all,
I posted about this problem on another forum (with an image attachment)
http://python-forum.org/pythonforum/viewtopic.php?f=18&t=21951&p=99290#p99290
In the figure below white space that forms a trapezoid to the right
(slope then constant) and tear-shape white space to the left (due to
maxZ being too small) are expected and I have no issues with that.
The weird things are the sharp white shapes to the left. They are very
irregular and with a little different change in parameters they appear
at different places.
This looks like the path simplification bug that was fixed some time
before mpl 1.0. You can upgrade, or as a workaround you can turn off
path simplification by putting
path.simplify : False
in your matplotlibrc file, or by using
matplotlib.rcParams['path.simplify'] = False
in your script.
Eric
Below are the relevant pieces of code
Code: Select all
import matplotlib.pyplot as plt
import matplotlib.colors as colors
...
z = numpy.transpose(z)
z = numpy.ma.masked_where(z<=0, z)
levels = numpy.linspace(0,maxZ,50)
cset1=plt.contourf(x,y,z,levels,cmap=plt.get_cmap('jet',len(levels)-1))
plt.colorbar(cset1)
fname = 'pic.png'
plt.savefig(fname)
Above, z is the 2D array of values for different x and y (both lists
have 400 elements each).
Ths is really really confusing me. Any help is greatly appreciated!
------------------------------------------------------------------------------
Beautiful is writing same markup. Internet Explorer 9 supports
standards for HTML5, CSS3, SVG 1.1, ECMAScript5, and DOM L2& L3.
Spend less time writing and rewriting code and more time creating great
experiences on the web. Be a part of the beta today
http://p.sf.net/sfu/msIE9-sfdev2dev
_______________________________________________
Matplotlib-users mailing list
Matplotlib-users@lists.sourceforge.net
matplotlib-users List Signup and Options
------------------------------------------------------------------------------
Beautiful is writing same markup. Internet Explorer 9 supports
standards for HTML5, CSS3, SVG 1.1, ECMAScript5, and DOM L2 & L3.
Spend less time writing and rewriting code and more time creating great
experiences on the web. Be a part of the beta today
http://p.sf.net/sfu/msIE9-sfdev2dev
_______________________________________________
Matplotlib-users mailing list
Matplotlib-users@lists.sourceforge.net
matplotlib-users List Signup and Options
Thanks for the help. However, when I change the matplotlibrc file I
get the following message
"Bad key "path.simplify" on line 267 in
/HOME/.matplotlib/matplotlibrc.
You probably need to get an updated matplotlibrc file from
http://matplotlib.sf.net/matplotlibrc or from the matplotlib source
distribution"
I'd do the update but I don't have root access on the server
It sounds like you have an old enough version of mpl that it does not support rc configuration of the path simplification. If so, your only
option is to update mpl itself. It should be possible to build and install a local copy without root access, and put its location in your PYTHONPATH.
Eric
···
On 11/17/2010 01:28 PM, Ognjen Ilic wrote:
On Wed, Nov 17, 2010 at 1:20 PM, Eric Firing<efiring@...202...> wrote:
On 11/17/2010 07:35 AM, Ognjen Ilic wrote:
Hello all,
I posted about this problem on another forum (with an image attachment)
http://python-forum.org/pythonforum/viewtopic.php?f=18&t=21951&p=99290#p99290
In the figure below white space that forms a trapezoid to the right
(slope then constant) and tear-shape white space to the left (due to
maxZ being too small) are expected and I have no issues with that.
The weird things are the sharp white shapes to the left. They are very
irregular and with a little different change in parameters they appear
at different places.
This looks like the path simplification bug that was fixed some time
before mpl 1.0. You can upgrade, or as a workaround you can turn off
path simplification by putting
path.simplify : False
in your matplotlibrc file, or by using
matplotlib.rcParams['path.simplify'] = False
in your script.
Eric
Below are the relevant pieces of code
Code: Select all
import matplotlib.pyplot as plt
import matplotlib.colors as colors
...
z = numpy.transpose(z)
z = numpy.ma.masked_where(z<=0, z)
levels = numpy.linspace(0,maxZ,50)
cset1=plt.contourf(x,y,z,levels,cmap=plt.get_cmap('jet',len(levels)-1))
plt.colorbar(cset1)
fname = 'pic.png'
plt.savefig(fname)
Above, z is the 2D array of values for different x and y (both lists
have 400 elements each).
Ths is really really confusing me. Any help is greatly appreciated!
A really simple way to do this is (from the terminal in the matplotlib directory):
python setupegg.py install --user
Everything gets installed to your .local directory and your python installation should find it without problems.
Ben Root
···
On Wed, Nov 17, 2010 at 5:37 PM, Eric Firing <efiring@…202…> wrote:
On 11/17/2010 01:28 PM, Ognjen Ilic wrote:
Thanks for the help. However, when I change the matplotlibrc file I
get the following message
"Bad key “path.simplify” on line 267 in
/HOME/.matplotlib/matplotlibrc.
You probably need to get an updated matplotlibrc file from
http://matplotlib.sf.net/matplotlibrc or from the matplotlib source
distribution"
I’d do the update but I don’t have root access on the server
It sounds like you have an old enough version of mpl that it does not
support rc configuration of the path simplification. If so, your only
option is to update mpl itself. It should be possible to build and
install a local copy without root access, and put its location in your
PYTHONPATH.
Eric