Now that I have some familiarity with matplotlib, and I've read the
cookbook/wiki page on embedding, I'd like recommendations to sort out my
options.
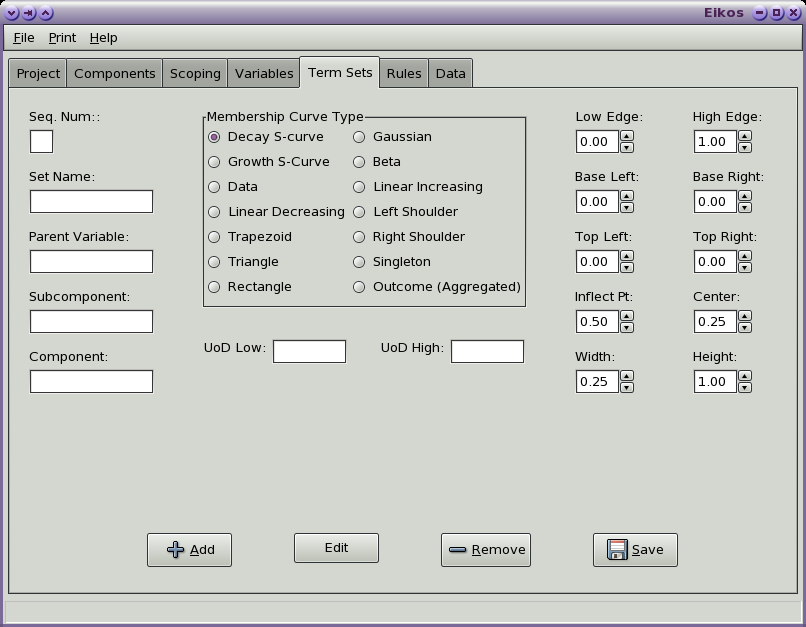
I don't need user interaction. On the display side, I have a notebook tab
with a panel on which there are a bunch of widgets. These widgets allow the
user to specify a curve shape and the characteristics of that curve. A
screen shot of this tab is attached.
In the available space above the buttons I want to put a small canvas that
displays the curve just defined when the 'Save' button is clicked. The x
axis is always 0-100, so the individual curve will be displayed in the
appropriate position along that axis. The y axis is always 0.0-1.0, and the
maximum height of each curve is 1.0. Again, this is strictly for display.
The wiki suggests either MPlot or WxMpl for embedding. Which might be
preferable for a display-only use? In other words, what would be the
simpliest, easiest, most pragmatic approach?
Rich
···
--
Richard B. Shepard, Ph.D. | Integrity Credibility
Applied Ecosystem Services, Inc. | Innovation
<http://www.appl-ecosys.com> Voice: 503-667-4517 Fax: 503-667-8863