I am wondering if there is a way to view my data with respect to the
physical size of what my array element is suppose to be.
I have an array that is 60 x 4000 where,
the first row has a height of 1.4
the next nine has a height of 1
the next forty has a height of 0.5
the next nine has a height of 1
and the last one has a height of 1.4
When viewing this with contourf or pcolor, the image is more narrow
than it should be. Is there an easy way to view this properly.
Bryan
···
--
"The game of science can accurately be described as a never-ending
insult to human intelligence." - João Magueijo
You can provide mesh coordinates to the pcolor command:
X and Y, if given, specify the (x,y) coordinates of the colored
quadrilaterals; the quadrilateral for C[i,j] has corners at
(X[i,j],Y[i,j]), (X[i,j+1],Y[i,j+1]), (X[i+1,j],Y[i+1,j]),
(X[i+1,j+1],Y[i+1,j+1]).  Ideally the dimensions of X and Y
should be one greater than those of C; if the dimensions are the
same, then the last row and column of C will be ignored.
Actually generating the mesh is up to you (wink), but hopefully that allows for what you need to do.
Cheers,
Mike
Bryan Fodness wrote:
···
I am wondering if there is a way to view my data with respect to the
physical size of what my array element is suppose to be.
I have an array that is 60 x 4000 where,
the first row has a height of 1.4
the next nine has a height of 1
the next forty has a height of 0.5
the next nine has a height of 1
and the last one has a height of 1.4
When viewing this with contourf or pcolor, the image is more narrow
than it should be. Is there an easy way to view this properly.
Bryan
--
Michael Droettboom
Science Software Branch
Operations and Engineering Division
Space Telescope Science Institute
Operated by AURA for NASA
Could someone give me an idea how to get started with this so it
coincides with my array of values. I took a look at the quadmesh_demo
in the examples and do not see a straightforward way to do this
···
On Nov 26, 2007 7:52 AM, Michael Droettboom <mdroe@...86...> wrote:
You can provide mesh coordinates to the pcolor command:
X and Y, if given, specify the (x,y) coordinates of the colored
quadrilaterals; the quadrilateral for C[i,j] has corners at
(X[i,j],Y[i,j]), (X[i,j+1],Y[i,j+1]), (X[i+1,j],Y[i+1,j]),
(X[i+1,j+1],Y[i+1,j+1]). Ideally the dimensions of X and Y
should be one greater than those of C; if the dimensions are the
same, then the last row and column of C will be ignored.
Actually generating the mesh is up to you (wink), but hopefully that
allows for what you need to do.
Cheers,
Mike
Bryan Fodness wrote:
> I am wondering if there is a way to view my data with respect to the
> physical size of what my array element is suppose to be.
>
> I have an array that is 60 x 4000 where,
> the first row has a height of 1.4
> the next nine has a height of 1
> the next forty has a height of 0.5
> the next nine has a height of 1
> and the last one has a height of 1.4
>
> When viewing this with contourf or pcolor, the image is more narrow
> than it should be. Is there an easy way to view this properly.
>
> Bryan
>
--
Michael Droettboom
Science Software Branch
Operations and Engineering Division
Space Telescope Science Institute
Operated by AURA for NASA
--
"The game of science can accurately be described as a never-ending
insult to human intelligence." - João Magueijo
Bryan Fodness wrote:
Could someone give me an idea how to get started with this so it
coincides with my array of values. I took a look at the quadmesh_demo
in the examples and do not see a straightforward way to do this
Maybe the docstrings make it sound more complicated than it really is. In your case you have an array of rectangles, not general quadrilaterals. All you need are two 1-D arrays, one each for the x and y grid boundaries. Something like this:
Z = numpy.random.rand(60,4000)
X = numpy.arange(4001)
Y = numpy.array([0, 1.4] + [1.0]*9 + [0.5]*40 + [1]*9 + [1.4]).cumsum()
pcolor(X, Y, Z)
pcolormesh should work the same, but when I try it now with svn it doesn't; I don't know what is going on with it. If you are using a release version of mpl, I expect it will work.
Eric
···
On Nov 26, 2007 7:52 AM, Michael Droettboom <mdroe@...86...> wrote:
You can provide mesh coordinates to the pcolor command:
X and Y, if given, specify the (x,y) coordinates of the colored
quadrilaterals; the quadrilateral for C[i,j] has corners at
(X[i,j],Y[i,j]), (X[i,j+1],Y[i,j+1]), (X[i+1,j],Y[i+1,j]),
(X[i+1,j+1],Y[i+1,j+1]). Ideally the dimensions of X and Y
should be one greater than those of C; if the dimensions are the
same, then the last row and column of C will be ignored.
Actually generating the mesh is up to you (wink), but hopefully that
allows for what you need to do.
Cheers,
Mike
Bryan Fodness wrote:
I am wondering if there is a way to view my data with respect to the
physical size of what my array element is suppose to be.
I have an array that is 60 x 4000 where,
the first row has a height of 1.4
the next nine has a height of 1
the next forty has a height of 0.5
the next nine has a height of 1
and the last one has a height of 1.4
When viewing this with contourf or pcolor, the image is more narrow
than it should be. Is there an easy way to view this properly.
Bryan
--
Michael Droettboom
Science Software Branch
Operations and Engineering Division
Space Telescope Science Institute
Operated by AURA for NASA
Thank You! It works great.
···
On Nov 26, 2007 7:02 PM, Eric Firing <efiring@...202...> wrote:
Bryan Fodness wrote:
 > Could someone give me an idea how to get started with this so it
 > coincides with my array of values.  I took a look at the
quadmesh_demo
 > in the examples and do not see a straightforward way to do this

Maybe the docstrings make it sound more complicated than it really is.
 In your case you have an array of rectangles, not general
quadrilaterals.  All you need are two 1-D arrays, one each for the x
and
y grid boundaries.  Something like this:
Z = numpy.random.rand(60,4000)
X = numpy.arange(4001)
Y = numpy.array([0, 1.4] + [1.0]*9 + [0.5]*40 + [1]*9 + [1.4]).cumsum()
pcolor(X, Y, Z)

pcolormesh should work the same, but when I try it now with svn it
doesn't; I don't know what is going on with it. If you are using a
release version of mpl, I expect it will work.
Eric
>
> On Nov 26, 2007 7:52 AM, Michael Droettboom <mdroe@...86...> wrote:
>> You can provide mesh coordinates to the pcolor command:
>>
>> X and Y, if given, specify the (x,y) coordinates of the colored
>> quadrilaterals; the quadrilateral for C[i,j] has corners at
>> (X[i,j],Y[i,j]), (X[i,j+1],Y[i,j+1]), (X[i+1,j],Y[i+1,j]),
>> (X[i+1,j+1],Y[i+1,j+1]). Ideally the dimensions of X and Y
>> should be one greater than those of C; if the dimensions are the
>> same, then the last row and column of C will be ignored.
>>
>> Actually generating the mesh is up to you (wink), but hopefully that
>> allows for what you need to do.
>>
>> Cheers,
>> Mike
>>
>>
>> Bryan Fodness wrote:
>>> I am wondering if there is a way to view my data with respect to the
>>> physical size of what my array element is suppose to be.
>>>
>>> I have an array that is 60 x 4000 where,
>>> the first row has a height of 1.4
>>> the next nine has a height of 1
>>> the next forty has a height of 0.5
>>> the next nine has a height of 1
>>> and the last one has a height of 1.4
>>>
>>> When viewing this with contourf or pcolor, the image is more narrow
>>> than it should be. Is there an easy way to view this properly.
>>>
>>> Bryan
>>>
>> --
>> Michael Droettboom
>> Science Software Branch
>> Operations and Engineering Division
>> Space Telescope Science Institute
>> Operated by AURA for NASA
>>
>
>
>
--
"The game of science can accurately be described as a never-ending
insult to human intelligence." - João Magueijo
I would also like to get the area of the mesh element when I fill the corresponding array element.
if a[1,0]
area = 1.0 * 0.01
if a[30,0]
area = 0.5 * 0.01
Is this possible?
···
On Nov 26, 2007 7:02 PM, Eric Firing <efiring@…202…> wrote:
Bryan Fodness wrote:
Could someone give me an idea how to get started with this so it
coincides with my array of values. I took a look at the quadmesh_demo
in the examples and do not see a straightforward way to do this
Maybe the docstrings make it sound more complicated than it really is.
In your case you have an array of rectangles, not general
quadrilaterals. All you need are two 1-D arrays, one each for the x and
y grid boundaries. Something like this:
Z = numpy.random.rand(60,4000)
X = numpy.arange(4001)
Y = numpy.array([0, 1.4] + [1.0]*9 + [0.5]*40 + [1]*9 + [1.4]).cumsum()
pcolor(X, Y, Z)
pcolormesh should work the same, but when I try it now with svn it
doesn’t; I don’t know what is going on with it. If you are using a
release version of mpl, I expect it will work.
Eric
On Nov 26, 2007 7:52 AM, Michael Droettboom <mdroe@…86…> wrote:
You can provide mesh coordinates to the pcolor command:
X and Y, if given, specify the (x,y) coordinates of the colored
quadrilaterals; the quadrilateral for C[i,j] has corners at
(X[i,j],Y[i,j]), (X[i,j+1],Y[i,j+1]), (X[i+1,j],Y[i+1,j]),
(X[i+1,j+1],Y[i+1,j+1]). Ideally the dimensions of X and Y
should be one greater than those of C; if the dimensions are the
same, then the last row and column of C will be ignored.
Actually generating the mesh is up to you (wink), but hopefully that
allows for what you need to do.
Cheers,
Mike
Bryan Fodness wrote:
I am wondering if there is a way to view my data with respect to the
physical size of what my array element is suppose to be.
I have an array that is 60 x 4000 where,
the first row has a height of 1.4
the next nine has a height of 1
the next forty has a height of 0.5
the next nine has a height of 1
and the last one has a height of 1.4
When viewing this with contourf or pcolor, the image is more narrow
than it should be. Is there an easy way to view this properly.
Bryan
–
Michael Droettboom
Science Software Branch
Operations and Engineering Division
Space Telescope Science Institute
Operated by AURA for NASA
–
“The game of science can accurately be described as a never-ending insult to human intelligence.” - João Magueijo
Bryan Fodness wrote:
I would also like to get the area of the mesh element when I fill the corresponding array element.
if a[1,0]
area = 1.0 * 0.01
if a[30,0]
area = 0.5 * 0.01
Is this possible?
I'm sorry, but I don't understand what you are asking. Are you asking how to calculate an array of areas corresponding to the grid? You know what the delta-Y values are:
dy = numpy.array([1.4] + [1.0]*9 + [0.5]*40 + [1]*9 + [1.4])
Are you looking for
area = dy * 0.01
?
Eric
···
On Nov 26, 2007 7:02 PM, Eric Firing <efiring@...202... > <mailto:efiring@…202…>> wrote:
Bryan Fodness wrote:
> Could someone give me an idea how to get started with this so it
> coincides with my array of values. I took a look at the
quadmesh_demo
> in the examples and do not see a straightforward way to do this
Maybe the docstrings make it sound more complicated than it really is.
In your case you have an array of rectangles, not general
quadrilaterals. All you need are two 1-D arrays, one each for the x
and
y grid boundaries. Something like this:
Z = numpy.random.rand(60,4000)
X = numpy.arange(4001)
Y = numpy.array([0, 1.4] + [1.0]*9 + [0.5]*40 + [1]*9 + [1.4]).cumsum()
pcolor(X, Y, Z)
pcolormesh should work the same, but when I try it now with svn it
doesn't; I don't know what is going on with it. If you are using a
release version of mpl, I expect it will work.
Eric
>
> On Nov 26, 2007 7:52 AM, Michael Droettboom <mdroe@...86... > <mailto:mdroe@…86…>> wrote:
>> You can provide mesh coordinates to the pcolor command:
>>
>> X and Y, if given, specify the (x,y) coordinates of the colored
>> quadrilaterals; the quadrilateral for C[i,j] has corners at
>> (X[i,j],Y[i,j]), (X[i,j+1],Y[i,j+1]), (X[i+1,j],Y[i+1,j]),
>> (X[i+1,j+1],Y[i+1,j+1]). Ideally the dimensions of X and Y
>> should be one greater than those of C; if the dimensions are the
>> same, then the last row and column of C will be ignored.
>>
>> Actually generating the mesh is up to you (wink), but hopefully that
>> allows for what you need to do.
>>
>> Cheers,
>> Mike
>>
>> Bryan Fodness wrote:
>>> I am wondering if there is a way to view my data with respect
to the
>>> physical size of what my array element is suppose to be.
>>>
>>> I have an array that is 60 x 4000 where,
>>> the first row has a height of 1.4
>>> the next nine has a height of 1
>>> the next forty has a height of 0.5
>>> the next nine has a height of 1
>>> and the last one has a height of 1.4
>>>
>>> When viewing this with contourf or pcolor, the image is more narrow
>>> than it should be. Is there an easy way to view this properly.
>>>
>>> Bryan
>>>
>> --
>> Michael Droettboom
>> Science Software Branch
>> Operations and Engineering Division
>> Space Telescope Science Institute
>> Operated by AURA for NASA
>>
>
--
"The game of science can accurately be described as a never-ending insult to human intelligence." - Jo�o Magueijo
Thanks, this is what I wanted. I overlooked the cumsum() on the end of my array, so the output of the array was not what I expected or needed.
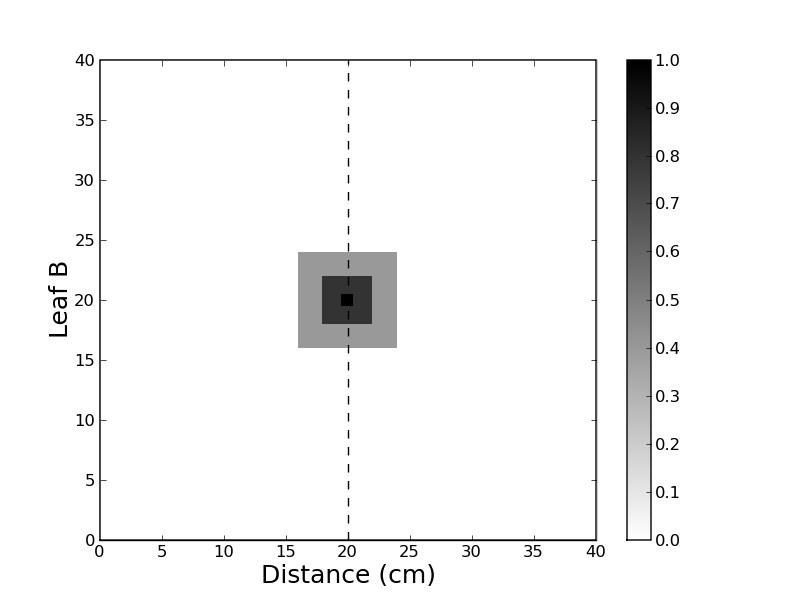
Could you help me figure out how to get an axis label and numbers on the right side of my graph. It is the same data and scale as the left side except it will read Leaf B.
···
On Dec 14, 2007 9:09 PM, Eric Firing <efiring@…202…> wrote:
Bryan Fodness wrote:
I would also like to get the area of the mesh element when I fill the
corresponding array element.
if a[1,0]
area = 1.0 * 0.01
if a[30,0]
area = 0.5 * 0.01
Is this possible?
I’m sorry, but I don’t understand what you are asking. Are you asking
how to calculate an array of areas corresponding to the grid? You know
what the delta-Y values are:
dy = numpy.array([1.4] + [1.0]*9 + [0.5]*40 + [1]*9 + [1.4])
Are you looking for
area = dy * 0.01
?
Eric
On Nov 26, 2007 7:02 PM, Eric Firing <efiring@…202… > > mailto:efiring@...202...> wrote:
Bryan Fodness wrote:
> Could someone give me an idea how to get started with this so it
> coincides with my array of values. I took a look at the
quadmesh_demo
> in the examples and do not see a straightforward way to do this
Maybe the docstrings make it sound more complicated than it really is.
In your case you have an array of rectangles, not general
quadrilaterals. All you need are two 1-D arrays, one each for the x
and
y grid boundaries. Something like this:
Z = numpy.random.rand(60,4000)
X = numpy.arange(4001)
Y = numpy.array([0, 1.4] + [1.0]*9 + [0.5]*40 + [1]*9 + [1.4]).cumsum()
pcolor(X, Y, Z)
pcolormesh should work the same, but when I try it now with svn it
doesn't; I don't know what is going on with it.  If you are using a
release version of mpl, I expect it will work.

Eric

 >
 > On Nov 26, 2007 7:52 AM, Michael Droettboom < > mdroe@...86... > >     <mailto:mdroe@...86...>> wrote:
 >> You can provide mesh coordinates to the pcolor command:
 >>
 >>     X and Y, if given, specify the (x,y) coordinates of the colored
 >>     quadrilaterals; the quadrilateral for C[i,j] has corners at
 >>     (X[i,j],Y[i,j]), (X[i,j+1],Y[i,j+1]), (X[i+1,j],Y[i+1,j]),
 >>     (X[i+1,j+1],Y[i+1,j+1]).  Ideally the dimensions of X and Y
 >>     should be one greater than those of C; if the dimensions are the
 >>     same, then the last row and column of C will be ignored.
 >>
 >> Actually generating the mesh is up to you (wink), but hopefully that
 >> allows for what you need to do.
 >>
 >> Cheers,
 >> Mike
 >>
 >>
 >> Bryan Fodness wrote:
 >>> I am wondering if there is a way to view my data with respect
to the
 >>> physical size of what my array element is suppose to be.
 >>>
 >>> I have an array that is 60 x 4000 where,
 >>>     the first row has a height of 1.4
 >>>     the next nine has a height of 1
 >>>     the next forty has a height of 0.5
 >>>     the next nine has a height of 1
 >>>     and the last one has a height of 1.4
 >>>
 >>> When viewing this with contourf or pcolor, the image is more narrow
 >>> than it should be.  Is there an easy way to view this properly.
 >>>
 >>> Bryan
 >>>
 >> --
 >> Michael Droettboom
 >> Science Software Branch
 >> Operations and Engineering Division
 >> Space Telescope Science Institute
 >> Operated by AURA for NASA
 >>
 >
 >
 >
–
“The game of science can accurately be described as a never-ending
insult to human intelligence.” - João Magueijo
–
“The game of science can accurately be described as a never-ending insult to human intelligence.” - João Magueijo