Varying alpha in ListedColormap not working

Hi,

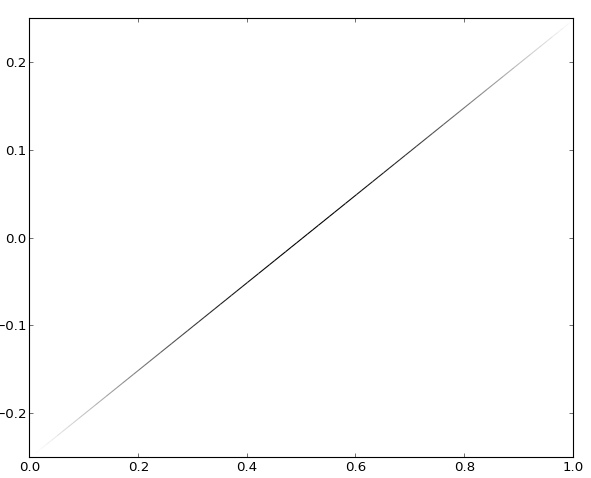
I've been trying to plot a line with varying alpha (but constant color). After much googling I have come up with the following code segment, which by all indications should work. It works when I vary an individual RGB element, but not when I vary alpha.

···

#################################################
import numpy as np
import matplotlib.pyplot as plt
from matplotlib.collections import LineCollection
from matplotlib.colors import ListedColormap, BoundaryNorm

# the line to plot
x = np.linspace(0,1,101)
y = x*0.5-0.25
scaling = np.exp(-(x-0.5)**2/0.5**2) # scale the transparency of the line according to this

# Create a colormap which has a constant color, but varies the transparency.
N = 50 # this many different transparency levels
alpha_boundaries = np.linspace(np.min(scaling),np.max(scaling),N+1)
# The lowest values are transparent, the highest ones are opaque
cmap = ListedColormap([(0.0,0.0,0.0,a) for a in np.linspace(0,1,N)])
norm = BoundaryNorm(alpha_boundaries, cmap.N)

# Create a set of line segments so that we can color them individually
# This creates the points as a N x 1 x 2 array so that we can stack points
# together easily to get the segments. The segments array for line collection
# needs to be numlines x points per line x 2 (x and y)
points = np.array([x, y]).T.reshape(-1, 1, 2)
segments = np.concatenate([points[:-1], points[1:]], axis=1)
    
# Create the line collection object, setting the colormapping parameters.
# Have to set the actual values used for colormapping separately.
lc = LineCollection(segments, cmap=cmap, norm=norm)
lc.set_array(scaling)

ax = plt.subplot(111)
ax.add_collection(lc)
plt.xlim(x.min(), x.max())
plt.ylim(y.min(), y.max())
plt.show()
#################################################

What appears to be happening is that the alpha values in the cmap I use when I create the ListedColormap object are being ignored by the add_collection function. I see that this bug (or something quite like it) was reported in late 2008:
http://matplotlib.1069221.n5.nabble.com/create-ListedColormap-with-different-alpha-values-tt18693.html#a18697

Did the patch from late 2008 not make it into the code, or has this bug resurfaced? Does anyone know of a workaround for this issue?

Cheers,
Oliver

It's all a blur now, but I don't think that patch made it in because
colormaps were inherently RGB not RGBA.

Something similar to that patch was merged in a year ago:
Colormap alpha by efiring · Pull Request #660 · matplotlib/matplotlib · GitHub and attached is the
result of running your code on my machine.

What is your matplotlib.__version__ ? I think that code only made it's
way into v1.2.0 (the latest stable), and was did not make it into
v1.1.1 (or anything before it)

2012-12-05-152024_591x478_scrot.png

···

On Wed, Dec 5, 2012 at 2:36 PM, Oliver King <oliver.africa@...287...> wrote:

What appears to be happening is that the alpha values in the cmap I use when I create the ListedColormap object are being ignored by the add_collection function. I see that this bug (or something quite like it) was reported in late 2008:
http://matplotlib.1069221.n5.nabble.com/create-ListedColormap-with-different-alpha-values-tt18693.html#a18697

Did the patch from late 2008 not make it into the code, or has this bug resurfaced? Does anyone know of a workaround for this issue?

--
Paul Ivanov
314 address only used for lists, off-list direct email at:
http://pirsquared.org | GPG/PGP key id: 0x0F3E28F7

What is your matplotlib.__version__ ? I think that code only made it's
way into v1.2.0 (the latest stable), and was did not make it into
v1.1.1 (or anything before it)

I'm running 1.1.0 - I'll upgrade it now. Thanks for the help!

Oliver

Incidentally, if anyone else wants to do this and is unable to update their matplotlib to v1.2.0, this code snippet achieves the same effect.

···

#######################################
import numpy as np
import matplotlib.pyplot as plt
from matplotlib.collections import LineCollection

# the line to plot
x = np.linspace(0,1,101)
y = x*0.5-0.25
scaling = np.exp(-(x-0.5)**2/0.5**2) # scale the transparency of the line according to this

points = np.array([x, y]).T.reshape(-1, 1, 2)
segments = np.concatenate([points[:-1], points[1:]], axis=1)

smin = scaling.min()
smax = scaling.max()
# inline function to convert scaling value to alpha value in [0,1]
alpha = lambda s0: (s0-smin)/(smax-smin)
        
# create a (r,g,b,a) color description for each line segment
cmap = []
for a in segments:
    # the x-value for this segment is:
    x0 = a.mean(0)[0]
    # so it has a scaling value of:
    s0 = np.interp(x0,x,scaling)
    # and it has an alpha value of:
    a0 = alpha(s0)
    cmap.append([0.0,0.0,0.0,a0])
    
# Create the line collection object, and set the color parameters.
lc = LineCollection(segments)
lc.set_color(cmap)

ax = plt.subplot(111)
ax.add_collection(lc)
ax.set_xlim(x.min(), x.max())
ax.set_ylim(y.min(), y.max())
plt.show()
#######################################