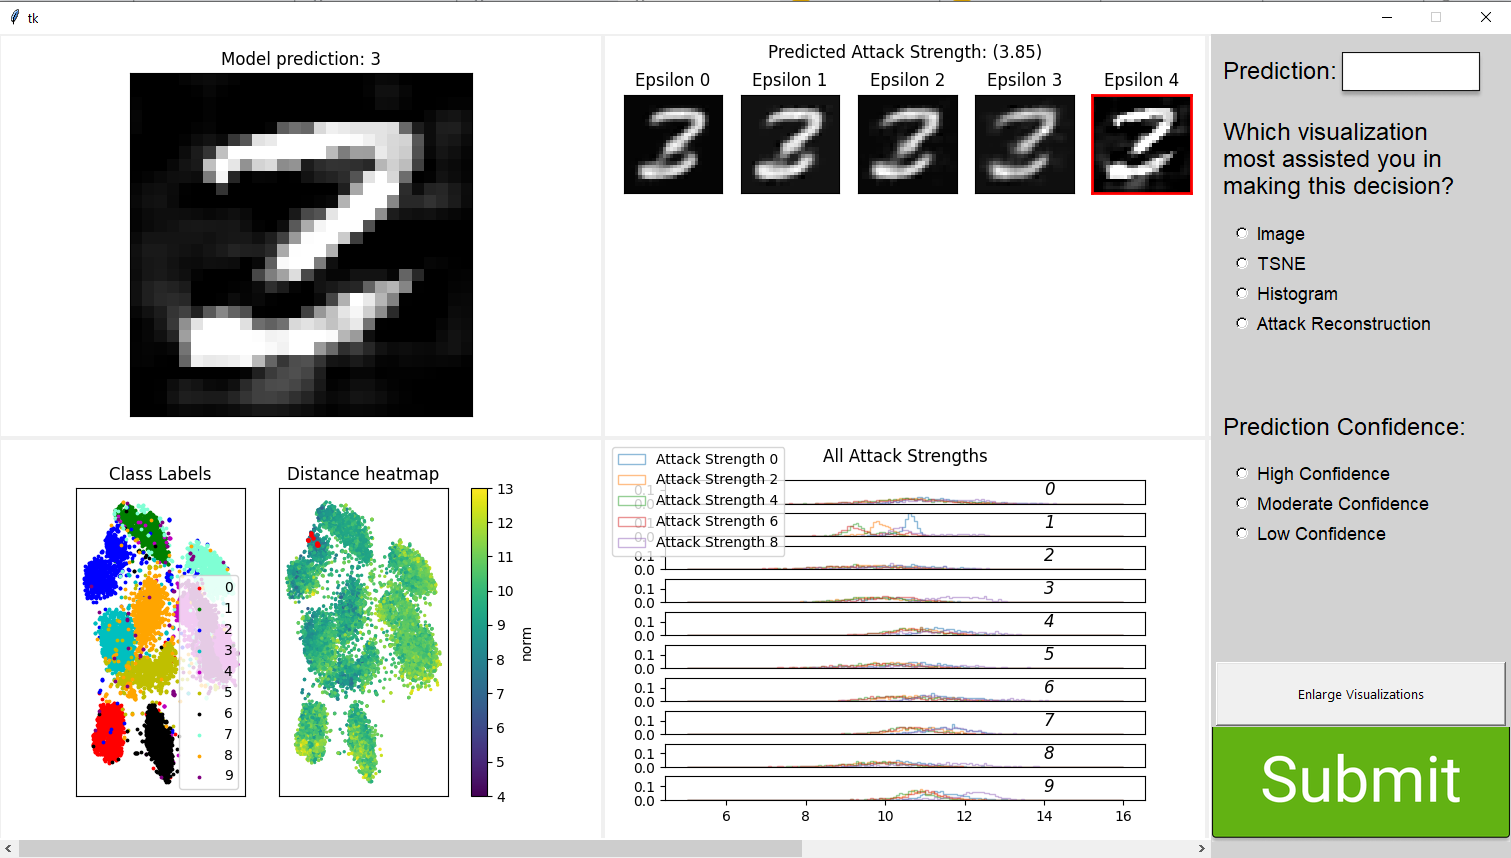
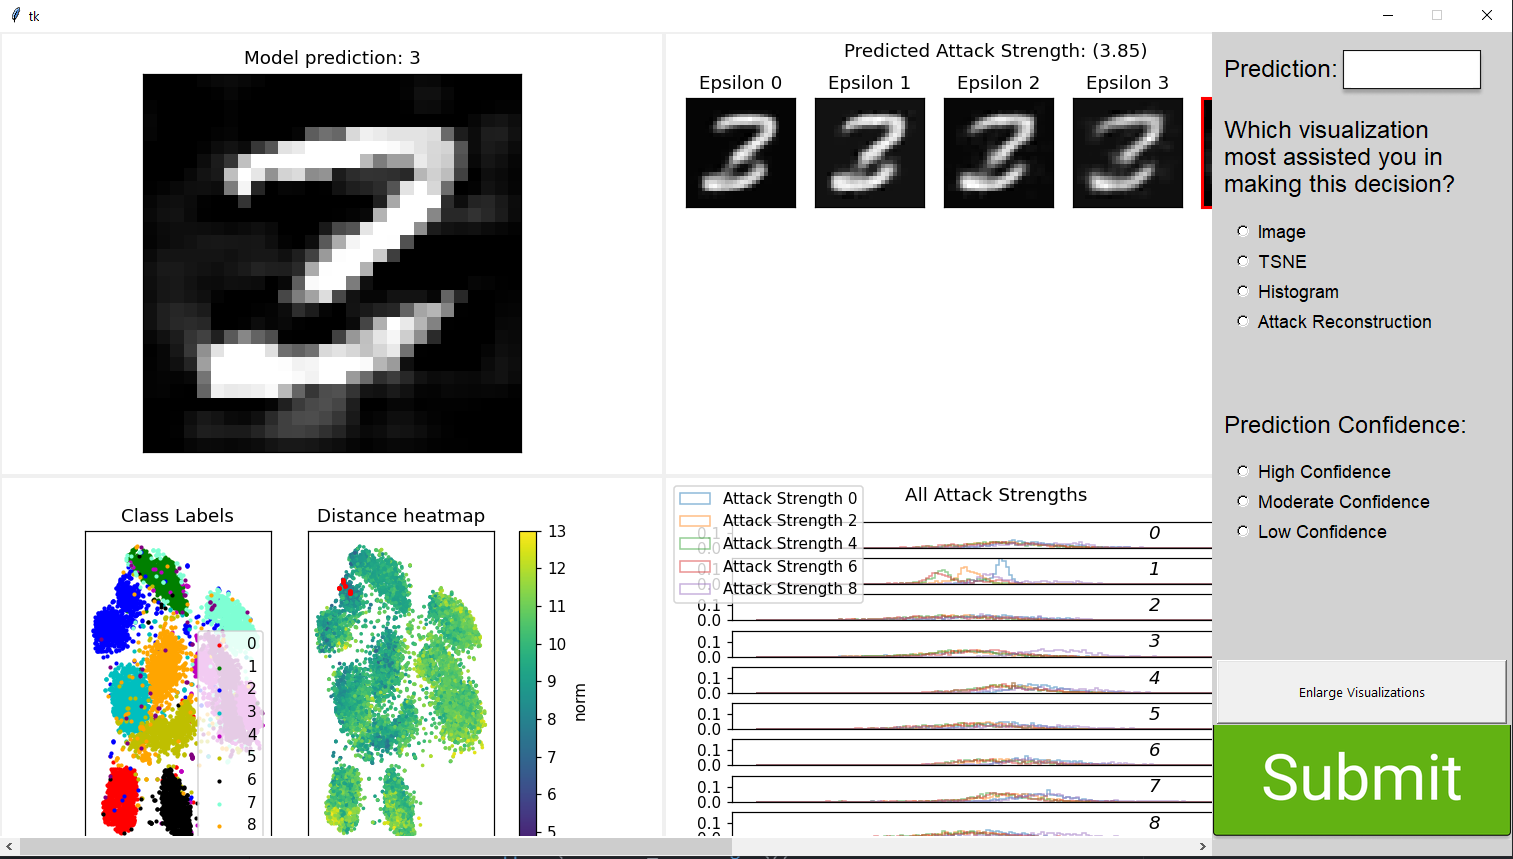
I’ve been working on a project while using matplotlib 3.4.3 and am trying to update to 3.5.3, but something fundamental is changing about how my plots look after I update. They are being scaled up and the text properties are being messed with. The scaling is around 1.1x larger and gets very messed up upon re-embedding. I also have no idea what’s going on with the text. Anyone know what’s going on here/how I can fix it?
Yup this seems to have been the case. I’m on win10 so the solution was to set the “Change the size of text, apps, and other items.” to 100% in settings>display>scale and layout. Wonder if maybe that setting wasn’t taken into account in older versions of matplotlib (or something to that effect) but is in newer versions?
I have a suspicion that this is related to Matplotlib being high-dpi aware but your application may not be so there is a disagreement about how big (in pixels) Matplotlib should render at.