units support in svn

If you are using mpl svn, please read this as it describes
some fairly major changes.

Mike Lusignan has been working on adding units support, and as a
consequence, partial support for working with arbitrary types in mpl.
The support is not complete yet, but it is basically working and
compatible with the rest of mpl, so I thought now would be a good time
to integrate it into the svn HEAD (he's been working in a branch)
and get some more eyeballs on it.

The code base is a little complicated and daunting at first, but we
are working to try and simplify it and refactor it so the main
functionality is minimally invasive into the rest of the code base.
Right now it is somewhat distributed among units, figure, axes,
artist, lines, patched, etc, but will be consolidated in the upcoming
week(s). Not all of the plotting functions support units, but the
examples show some with scatter and plot.

The documentation is in matplotlib.units. We do not assume any
particular units package, we only require that package to provide
a certain interface. Alternatively, one can use a units type that doesn't
have the required interface as long as you register some adaptors with
the figure. More on this later. Mike also provided a mockup units package
in the examples/units dir called basic_unit.py to test and demo the support.

I ran into a little problem today in trying to reconcile Eric's work
supporting multicolumn y data with the unit support for arbitrary
types. The basic tension is in _process_plot_var_args._xy_from_xy and
friends which simplfies the array column logic by forcing all inputs
to have a array.shape==2 using some conversion functions. The problem
is this strips out the units tagging Mike is relying on (in the
current implementation he needs _xorig in Line2D to be the original
data type). This is a fairly important question that
requires some thought: do we want mpl objects to store original data
objects as long as they know how to convert themselves under the hood
to something useful when requested (eg Text now supports any object
that supports '%s'%o. I think if we could support this generally,
that is the ideal, because it let's users use mpl with custom objects,
possibly from 3rd party closed src vendors, as long as the objects
expose the right interface. It's also useful for picking, where you
might want to store your custom objects and arrays in mpl and query
them later. If we lose access to the orginal data when constructing
our objects, we lose this ability. That said, we are fairly far from
achieving this goal globally.

I did a quick-and-dirty hack in process_plot_var_args for the time
being to get something everyone can chew on, which is to use the
existing approach if the data are indeed multicolumn, but use the
original x and y data otherwise. We'll come up with something more
general and elegant shortly.

backend_driver is passing in my local repository, and the units
examples are passing as well, and I thought this is sufficient
progress that it merits getting the merge done now and getting more
testers on this. I expect there will be some breakage
and performance hits, and we can fix these as they arise.

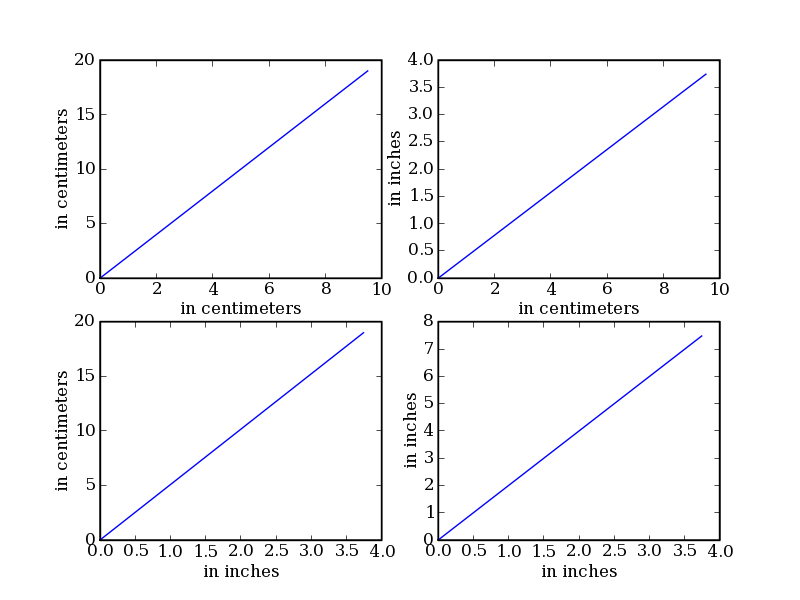
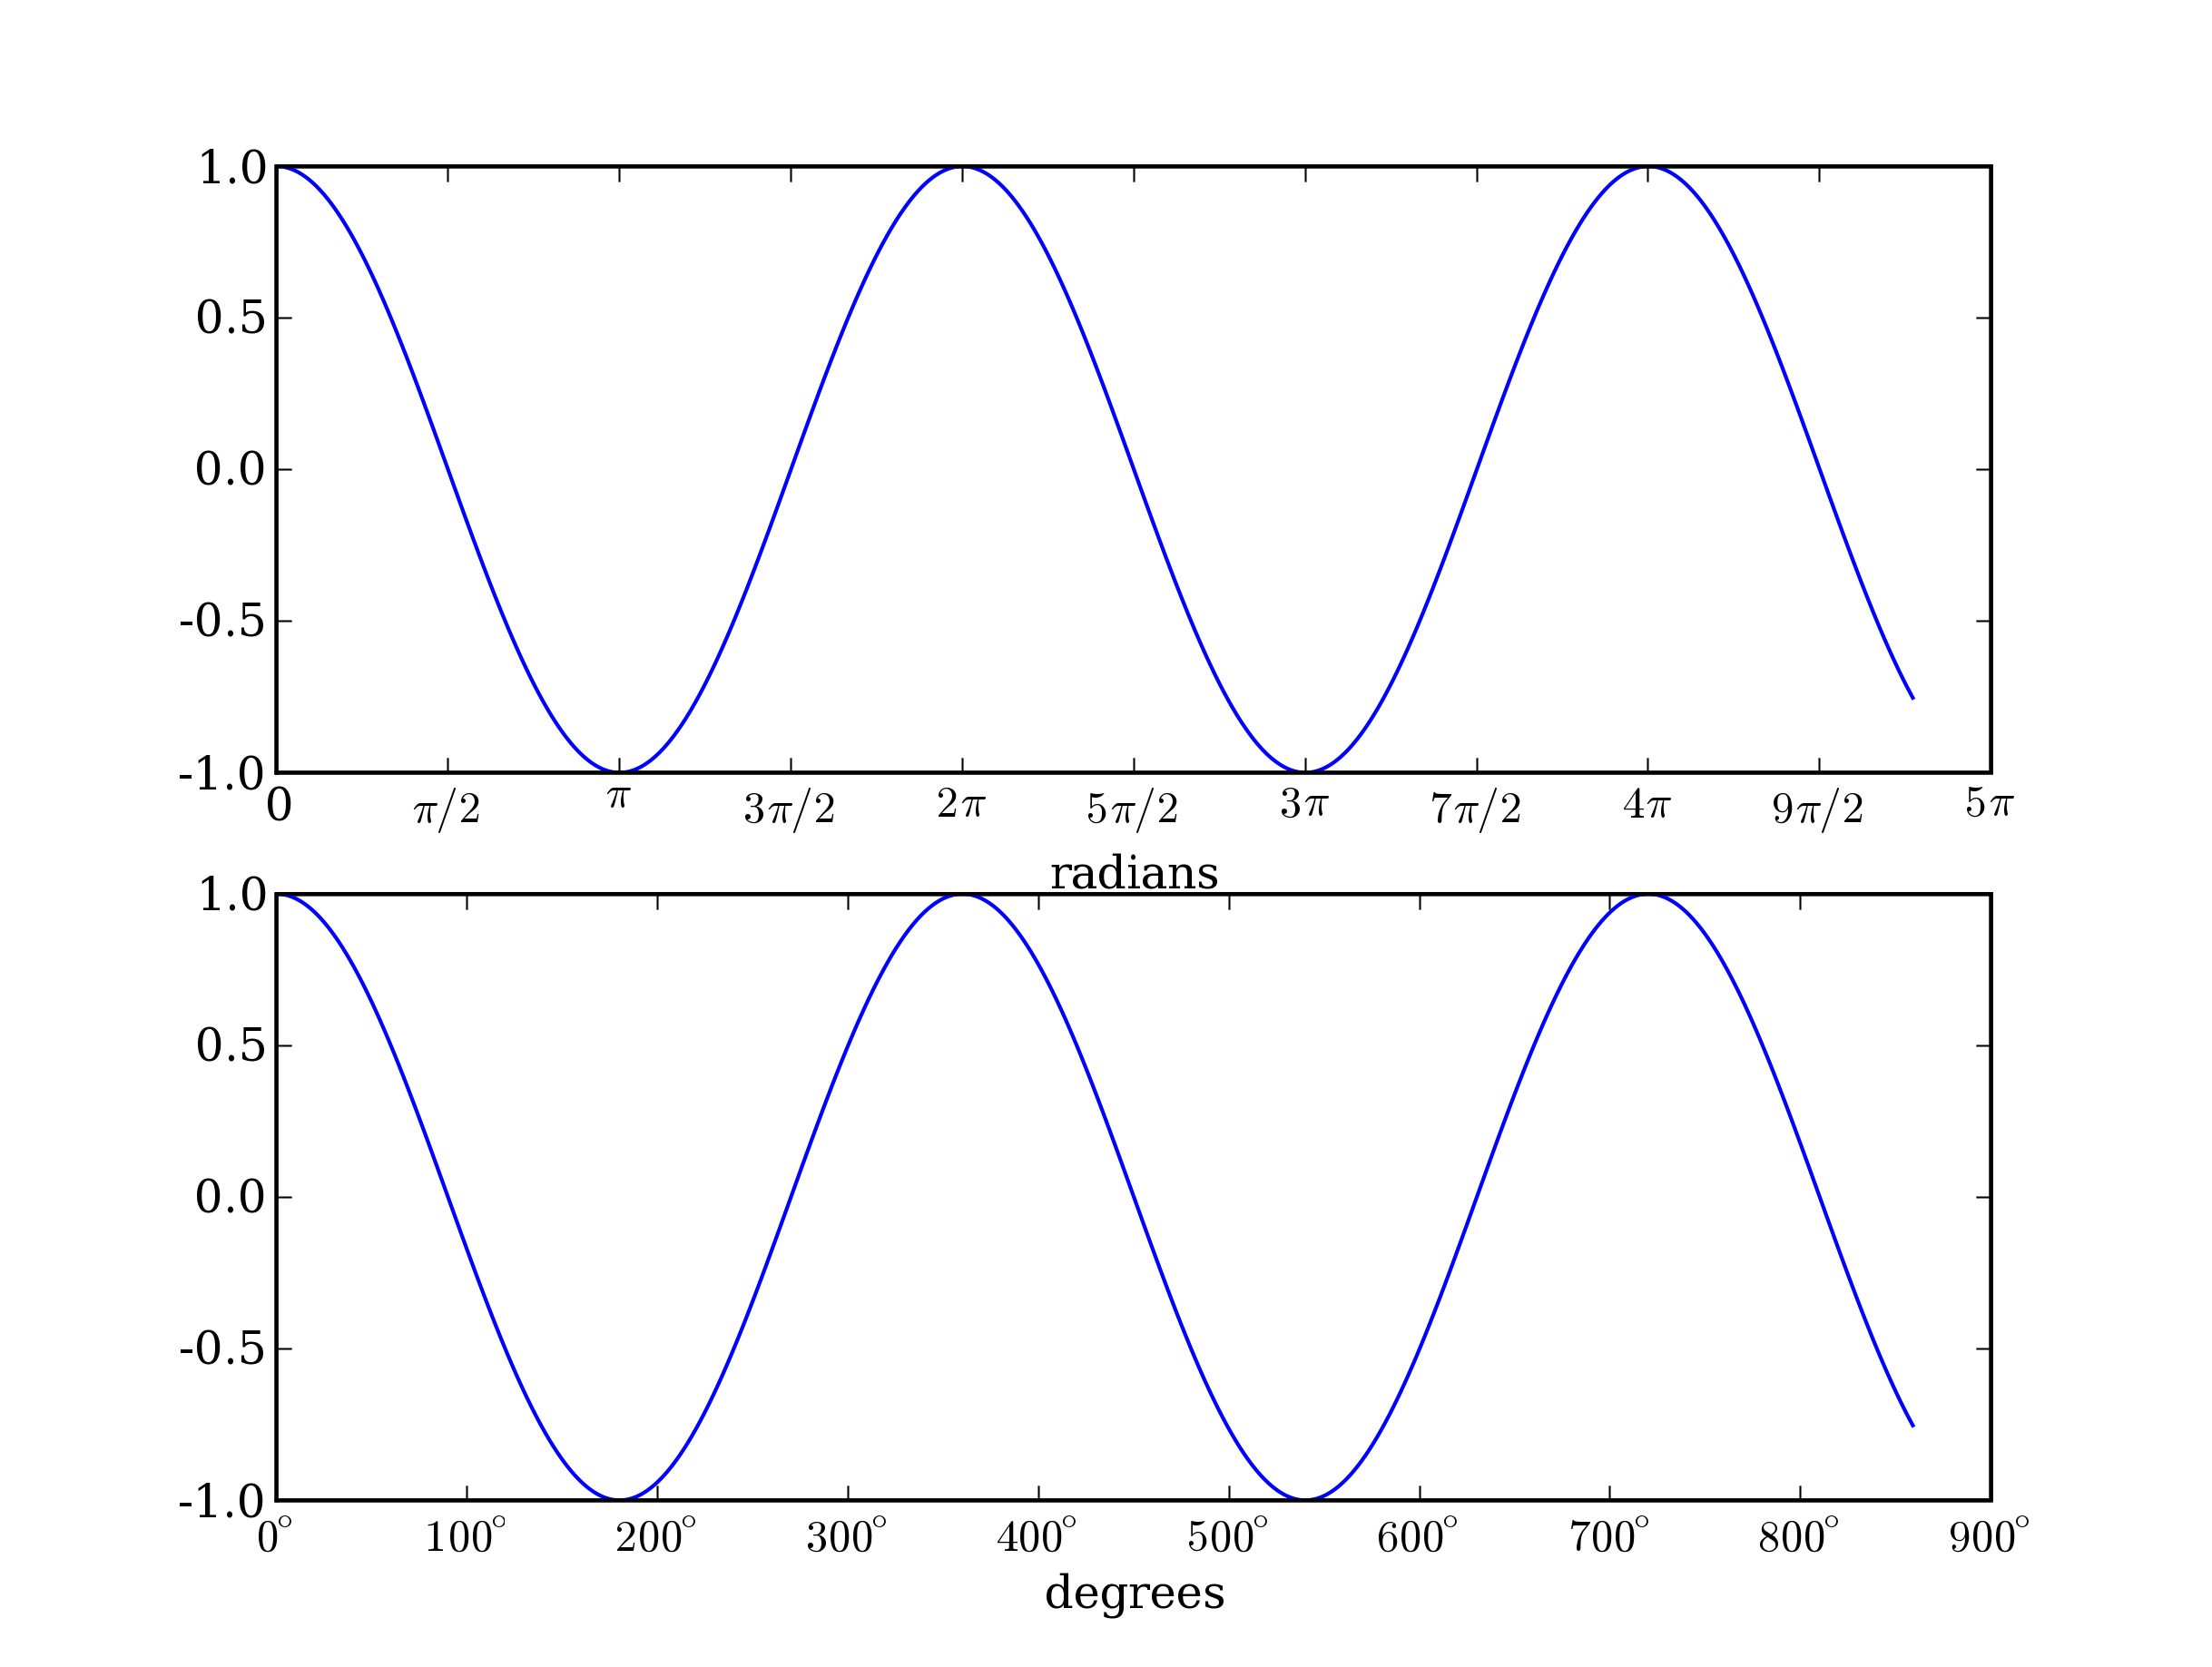
The new examples are in examples/units -- a couple of screenshot
of the example below is attached.

Thanks Mike!

JDH
import matplotlib
matplotlib.rcParams['numerix'] = 'numpy'

import basic_units as bu
import numpy as N
from pylab import figure, show
from matplotlib.cbook import iterable

cm = bu.BasicUnit('cm', 'centimeters')
inch = bu.BasicUnit('inch', 'inches')

inch.add_conversion_factor(cm, 2.54)
cm.add_conversion_factor(inch, 1/2.54)

lengths_cm = cm*N.arange(0, 10, 0.5)

# iterator test
print 'Testing iterators...'
for length in lengths_cm:
  print length

print 'Iterable() = ' + `iterable(lengths_cm)`

print 'cm', lengths_cm
print 'toinch', lengths_cm.convert_to(inch)
print 'toval', lengths_cm.convert_to(inch).get_value()

fig = figure()
ax1 = fig.add_subplot(2,2,1)
ax1.plot(lengths_cm, 2.0*lengths_cm, xunits=cm, yunits=cm)
ax1.set_xlabel('in centimeters')
ax1.set_ylabel('in centimeters')

ax2 = fig.add_subplot(2,2,2)
ax2.plot(lengths_cm, lengths_cm, xunits=cm, yunits=inch)
ax2.set_xlabel('in centimeters')
ax2.set_ylabel('in inches')

ax3 = fig.add_subplot(2,2,3)
ax3.plot(lengths_cm, 2.0*lengths_cm, xunits=inch, yunits=cm)
ax3.set_xlabel('in inches')
ax3.set_ylabel('in centimeters')

ax4 = fig.add_subplot(2,2,4)
ax4.plot(lengths_cm, 2.0*lengths_cm, xunits=inch, yunits=inch)
ax4.set_xlabel('in inches')
ax4.set_ylabel('in inches')
fig.savefig('simple_conversion_plot.png')

show()

simple_conversion_plot.png

John Hunter wrote:

If you are using mpl svn, please read this as it describes
some fairly major changes.

Mike Lusignan has been working on adding units support, and as a
consequence, partial support for working with arbitrary types in mpl.
The support is not complete yet, but it is basically working and
compatible with the rest of mpl, so I thought now would be a good time
to integrate it into the svn HEAD (he's been working in a branch)
and get some more eyeballs on it.

John,

You accidentally whacked out the new Axes.matshow, so I put it back.

I also noticed a few decorators--gasp!--in axes.py. I presume you will want them replaced by old-style syntax to preserve 2.3 compatibility, but I will leave that to you. (After about the 10th or so time of reading a bit about decorators, I think I understand them enough for simple use cases; apart from that ugly and utterly unpythonic @ symbol, maybe they are not as bad as I thought.)

The curmudgeon in me has to wonder whether the snazzy unit support is really a good thing; this is partly a question of where the boundary of a plotting library should be. The simpler view (classic mpl) is that the role of mpl is to do a good job plotting numbers and labeling things, and the role of the user or application programmer is to supply the numbers and labels. I am not sure that enough is gained by enabling unit conversion and automatic axis labeling inside a plot command to compensate for the added complexity. My hesitation probably reflects the facts (1) that I don't see any *compelling* use cases in the sort of work I do, (2) I am not familiar with whatever use cases motivated this, (3) I haven't thought about it much yet, and (4) I may be a bit unimaginative.

I will try to take a closer look, both at the changes and at the questions you raise in your message, tomorrow.

Eric

My first impression is similar to Eric's. I don't know if there is a robust
units package for python, but I imagine it should be a part of scipy. I think
it would be better to get an array and if you wanted to plot it in different
units, you call a method on the array at plot time. Maybe I dont understand
all the intended uses.

Darren

···

On Tuesday 20 March 2007 3:50:07 am Eric Firing wrote:

John Hunter wrote:
> If you are using mpl svn, please read this as it describes
> some fairly major changes.
>
> Mike Lusignan has been working on adding units support, and as a
> consequence, partial support for working with arbitrary types in mpl.
> The support is not complete yet, but it is basically working and
> compatible with the rest of mpl, so I thought now would be a good time
> to integrate it into the svn HEAD (he's been working in a branch)
> and get some more eyeballs on it.

John,

You accidentally whacked out the new Axes.matshow, so I put it back.

I also noticed a few decorators--gasp!--in axes.py. I presume you will
want them replaced by old-style syntax to preserve 2.3 compatibility,
but I will leave that to you. (After about the 10th or so time of
reading a bit about decorators, I think I understand them enough for
simple use cases; apart from that ugly and utterly unpythonic @ symbol,
maybe they are not as bad as I thought.)

The curmudgeon in me has to wonder whether the snazzy unit support is
really a good thing; this is partly a question of where the boundary of
a plotting library should be. The simpler view (classic mpl) is that
the role of mpl is to do a good job plotting numbers and labeling
things, and the role of the user or application programmer is to supply
the numbers and labels. I am not sure that enough is gained by enabling
unit conversion and automatic axis labeling inside a plot command to
compensate for the added complexity. My hesitation probably reflects
the facts (1) that I don't see any *compelling* use cases in the sort
of work I do, (2) I am not familiar with whatever use cases motivated
this, (3) I haven't thought about it much yet, and (4) I may be a bit
unimaginative.

--
Darren S. Dale, Ph.D.
dd55@...143...

Actually, I like the idea of unit support quite a bit and could well imagine that it makes sense
to support it explicitely in matplotlib.

I am using physical units very frequently in my computations. Lacking a robust units package,
I simply define the units as numerical constants without checks but at least with comfortable
conversion. If there were a good units package, support in matplotlib would mean that the axis
labels could automatically be completed with appropriate units without need for explicit conversion.

I agree, though, that the units package itself should not be part of matplotlib. But this is exactly
how I understand the idea by John Hunter: describe an interface to allow the use of any third-party
unit package.

Of course, the whole thing only makes sense is there is a units package that is fit for production use.

Darren Dale wrote:

···

My first impression is similar to Eric's. I don't know if there is a robust units package for python, but I imagine it should be a part of scipy. I think it would be better to get an array and if you wanted to plot it in different units, you call a method on the array at plot time. Maybe I dont understand all the intended uses.

Darren

FYI The unit system John is working on will be a huge improvement for the way we use MPL. Our users do a ton of plotting that involves unitized numbers vs time. We have our own unit class and time class and right now users have to convert the unitized numbers into floats in the correct units and convert the times to the correct MPL format in the correct reference frame. Being able to seamlessly pass these objects to MPL is going to make all of our plotting scripts much simpler to use, easier to understand, and much safer (by eliminating different unit/time frame problems).

It's not a big deal to convert values when the plot is first created - where it makes the biggest difference is when you want to manipulate the plot after it's created (xlim for example). Being able to pass unitized numbers to the various manipulation methods is what makes everything much easier to use (especially when dates are being plotted).

Ted

···

At 02:15 PM 3/20/2007, Norbert Nemec wrote:

Actually, I like the idea of unit support quite a bit and could well
imagine that it makes sense
to support it explicitely in matplotlib.

I am using physical units very frequently in my computations. Lacking a
robust units package,
I simply define the units as numerical constants without checks but at
least with comfortable
conversion. If there were a good units package, support in matplotlib
would mean that the axis
labels could automatically be completed with appropriate units without
need for explicit conversion.

I agree, though, that the units package itself should not be part of
matplotlib. But this is exactly
how I understand the idea by John Hunter: describe an interface to allow
the use of any third-party
unit package.

Of course, the whole thing only makes sense is there is a units package
that is fit for production use.

Darren Dale wrote:
>
> My first impression is similar to Eric's. I don't know if there is a robust
> units package for python, but I imagine it should be a part of scipy. I think
> it would be better to get an array and if you wanted to plot it in different
> units, you call a method on the array at plot time. Maybe I dont understand
> all the intended uses.
>
> Darren
>

-------------------------------------------------------------------------
Take Surveys. Earn Cash. Influence the Future of IT
Join SourceForge.net's Techsay panel and you'll get the chance to share your
opinions on IT & business topics through brief surveys-and earn cash
http://www.techsay.com/default.php?page=join.php&p=sourceforge&CID=DEVDEV
_______________________________________________
Matplotlib-devel mailing list
Matplotlib-devel@lists.sourceforge.net
matplotlib-devel List Signup and Options

You accidentally whacked out the new Axes.matshow, so I put it back.

Oops, sorry.

I also noticed a few decorators--gasp!--in axes.py. I presume you will
want them replaced by old-style syntax to preserve 2.3 compatibility,
but I will leave that to you. (After about the 10th or so time of
reading a bit about decorators, I think I understand them enough for
simple use cases; apart from that ugly and utterly unpythonic @ symbol,
maybe they are not as bad as I thought.)

The curmudgeon in me has to wonder whether the snazzy unit support is
really a good thing; this is partly a question of where the boundary of
a plotting library should be. The simpler view (classic mpl) is that
the role of mpl is to do a good job plotting numbers and labeling
things, and the role of the user or application programmer is to supply
the numbers and labels. I am not sure that enough is gained by enabling
unit conversion and automatic axis labeling inside a plot command to
compensate for the added complexity. My hesitation probably reflects
the facts (1) that I don't see any *compelling* use cases in the sort
of work I do, (2) I am not familiar with whatever use cases motivated
this, (3) I haven't thought about it much yet, and (4) I may be a bit
unimaginative.

I will try to take a closer look, both at the changes and at the
questions you raise in your message, tomorrow.

I too have been concerned by the complexity of this implementation --
I think it is trying to support too many paradigms, for example,
sequences of hetergeneous units. I have dramatically simplified the
code, and moved almost everything out of Axes. I have also made
"units" an rc param so that if units is not enabled, there is a dummy
do nothing units manager so you'll only pay for a few extra do nothing
function calls. Take a look at the code again when you get a minute,
I think you'll be more satisfied at the reduced complexity.

I've also cleaned up the examples to hopefully make clearer the
potential use cases. Eg, for radian plotting

    from basic_units import radians, degrees
    from pylab import figure, show, nx

    x = nx.arange(0, 15, 0.01) * radians

    fig = figure()

    ax = fig.add_subplot(211)
    ax.plot(x, nx.cos(x), xunits=radians)
    ax.set_xlabel('radians')

    ax = fig.add_subplot(212)
    ax.plot(x, nx.cos(x), xunits=degrees)
    ax.set_xlabel('degrees')

    show()

and see attached screenshot. One of the things this implementation
buys you is the units writer can provide a mapping from types to
locators and formatters -- notice in the attached screenshot how you
get the fancy tick locating and formatting. This enables a matplotlib
application developer to alter the default ticking and formatting
outside of the code base.

Here is another use case, working with native datetimes -- note that
we get to use native dates in plot and set_xlim

    import date_support # set up the date converters
    import datetime
    from pylab import figure, show, nx

    xmin = datetime.date(2007,1,1)
    xmax = datetime.date.today()

    xdates = [xmin]
    while 1:
        thisdate = xdates[-1] + datetime.timedelta(days=1)
        xdates.append(thisdate)
        if thisdate>=xmax: break

    fig = figure()
    fig.subplots_adjust(bottom=0.2)
    ax = fig.add_subplot(111)
    ax.plot(xdates, nx.mlab.rand(len(xdates)), 'o')
    ax.set_xlim(datetime.date(2007,2,1), datetime.date(2007,3,1))

    for label in ax.get_xticklabels():
        label.set_rotation(30)
        label.set_ha('right')
    show()

Some of the features were inspired by some real use cases that the JPL
has encountered in developing their monty application for ground
tracking of orbiting spacecraft. The basic problem is this. Imagine
you are a large C++ shop with a lot of legacy code and a python
interface, and you've decided to jettison your internal plotting
library for matplotlib. Your users work at a enhanced python shell
and have all of the legacy functionality and objects and want to so
something like

plot(o)

where o is one of these legacy objects. They may not know a lot of
matplotlib, but can do plot. Asking them to learn about tickers and
formatters and conversion to arrays etc may be a non-starter for many
of these users. You could wrap all of the bits of matplotlib that you
need and do the conversion under the hood for your users, but then you
will always be trying to keep up with the mpl changes. You can't
really change the objects to suit mpl because too much legacy code
depends on them. What the proposed changes allow the developer to do
is write a converter class and register their types with a unit
manager and mpl will do the conversions in the right place. In the
current implementation (heavily revised) this happens when the Axes
adds the artist to itself, which provides a finite number of points of
entry.

Here is what the converter code in date_support in the units example
directory (used in the demo above). Note that this pretty much
replaces all of the current plot_date functionality, but happens
outside mpl and doesn't require the user to think about date2num

    import matplotlib
    matplotlib.rcParams['units'] = True

    import matplotlib.units as units
    import matplotlib.dates as dates
    import matplotlib.ticker as ticker
    import basic_units
    import datetime

    class DateConverter(units.ConversionInterface):

        def tickers(x, unit=None):
            'return major and minor tick locators and formatters'
            majloc = dates.AutoDateLocator()
            minloc = ticker.NullLocator()
            majfmt = dates.AutoDateFormatter(majloc)
            minfmt = ticker.NullFormatter()
            return majloc, minloc, majfmt, minfmt
        tickers = staticmethod(tickers)

        def convert_to_value(value, unit):
            return dates.date2num(value)
        convert_to_value = staticmethod(convert_to_value)

    units.manager.converters[datetime.date] = DateConverter()

And I've gotten the units.py module down to a digestable 105 lines of
code!

I haven't finished porting all of the artists yet, eg there is work
left to do in collections and text, but lines, patches and regular
polygon collections are working, and there are more examples.

See if you find the new interface less onerous. There is still work
to do if we want to support this kind of thing -- one of the hard
parts is to modify the various plotting functions to try and get the
original data into the primitive objects, which the current approach
is building around.

I've also gotten rid of all the decorators and properties. The code
is not python2.3 compatible.

JDH

···

On 3/20/07, Eric Firing <efiring@...229...> wrote:

I agree, though, that the units package itself should not be part of
matplotlib. But this is exactly
how I understand the idea by John Hunter: describe an interface to allow
the use of any third-party
unit package.

That's exactly right -- we are not providing a units package and have
no intention of providing one. What this implementation is providing
is an interface that one can use with any units package, either a
publicly released one or a home grown one. Whether the interface is
robust enough to handle real world package remains to be seen with
further use and testing -- this is a first cut at it.

The basic_units package in examples/units was developed for
prototyping and testing, and was not meant to be the foundation of a
real units package. matplotlib.units.UnitConverter describes the
basic interface a unit converter class must expose.

Of course, the whole thing only makes sense is there is a units package
that is fit for production use.

Well, one can still use it to support home grown units, even if they
aren't production ready. And as the example date_converter.py shows,
the same framework works well for plotting custom types even if unit
conversion is not needed.

I think your suggestion of supporting default axis labels is also a
good one -- the current implementation supports tick labeling an
formatting and axis labeling is a natural target for unit handling
also.

JDH

···

On 3/20/07, Norbert Nemec <Norbert.Nemec.list@...159...> wrote:

And I've gotten the units.py module down to a digestable 105 lines of
code!

You must have done more work after writing your message--now wc reports only 87 lines!

Thanks for all the explanations (I am gradually coming around...) and additional work.

Minor points from a quick look at axes.py: a line in spy() got regressed, so I restored it (svn rev 3114); and **kwargs got added to the signatures of set_xlim and set_ylim, but they are not being used--all valid kwargs are explicit. I left this alone because maybe you are planning to pass kwargs through later.

See if you find the new interface less onerous. There is still work
to do if we want to support this kind of thing -- one of the hard
parts is to modify the various plotting functions to try and get the
original data into the primitive objects, which the current approach
is building around.

Looks promising. I see the problem, as in the example you pointed out with plotting multiple columns, but I don't have any suggestions yet.

I've also gotten rid of all the decorators and properties. The code
is not python2.3 compatible.

Properties would be OK for 2.3; I was thinking we might want to use them. When a getter and setter already exist, all it takes is the one extra line of code, plus a suitable (unused) name for the property. I decided not to pursue traits (if at all) until we can use the Enthought package as-is. But I think that properties could be converted to traits very easily if we wanted to do that in the future, so starting with properties would not be wasted effort. This is getting a bit off-topic, though.

Aha! Now I see that lines.py still has a few properties but they are private.

Eric

Minor note: if you are going to use properties, make sure all classes
using them are new-style (inherit from object). With old-style
classes, properties fail in silent and mysterious ways that may lead
to much head-scratching.

As far as I can see, it is not currently the case in lines.py (where
Line2D inherits from Artist, which is an old-style class).

agg.py, which makes extensive use of property(), has it properly
wrapped in the following:

import types
try:
    _object = types.ObjectType
    _newclass = 1
except AttributeError:
    class _object : pass
    _newclass = 0
del types

and then all calls to property() are of the form:

    if _newclass:x = property(_agg.point_type_x_get, _agg.point_type_x_set)

Currently the only two files I see using property() are agg.py and
lines.py; once artist.py is fixed to be new-style, things should be
fine.

And yes, properties are actually OK even with 2.2, so there's no
reason to avoid them (and they do provide a nicer, claner user API).
Decorators are 2.4-only though.

Cheers,

f

···

On 3/21/07, Eric Firing <efiring@...229...> wrote:

Properties would be OK for 2.3; I was thinking we might want to use
them. When a getter and setter already exist, all it takes is the one
extra line of code, plus a suitable (unused) name for the property. I
decided not to pursue traits (if at all) until we can use the Enthought
package as-is. But I think that properties could be converted to traits
very easily if we wanted to do that in the future, so starting with
properties would not be wasted effort. This is getting a bit off-topic,
though.

Fernando Perez wrote:

···

On 3/21/07, Eric Firing <efiring@...229...> wrote:

Properties would be OK for 2.3; I was thinking we might want to use
them. When a getter and setter already exist, all it takes is the one
extra line of code, plus a suitable (unused) name for the property. I
decided not to pursue traits (if at all) until we can use the Enthought
package as-is. But I think that properties could be converted to traits
very easily if we wanted to do that in the future, so starting with
properties would not be wasted effort. This is getting a bit off-topic,
though.

Minor note: if you are going to use properties, make sure all classes
using them are new-style (inherit from object). With old-style
classes, properties fail in silent and mysterious ways that may lead
to much head-scratching.

Not minor at all--I ran into exactly this problem a few months ago with my first foray into properties, and it did indeed take quite a bit of head-scratching before I realized the problem. And I am embarrassed to say that I had forgotten about it until your reminder above.

Thanks.

Eric

I'm not opposed to properties in principle -- I just didn't want to
start incorporating them by happenstance. We have the long running
unresolved issue of whether to use traits or properties, so I scrubbed
the properties as a foolish consitency, to stick to one design
approach until we have made a formal decision on how we want to
approach this, and then port mpl properties en masse.

But I think it would be a good idea to go ahead and derive Artist from
object to make sure this doesn't cause any troubles, and likewise for
the other top level classes, eg FigureCanvasBase and friends.

JDH

···

On 3/21/07, Fernando Perez <fperez.net@...149...> wrote:

And yes, properties are actually OK even with 2.2, so there's no
reason to avoid them (and they do provide a nicer, claner user API).
Decorators are 2.4-only though.

> And yes, properties are actually OK even with 2.2, so there's no
> reason to avoid them (and they do provide a nicer, claner user API).
> Decorators are 2.4-only though.

I'm not opposed to properties in principle -- I just didn't want to
start incorporating them by happenstance. We have the long running
unresolved issue of whether to use traits or properties, so I scrubbed
the properties as a foolish consitency, to stick to one design
approach until we have made a formal decision on how we want to
approach this, and then port mpl properties en masse.

I wasn't really voting for properties or traits, that decision is
ultimately your call. They both provide similar user-visible benefits
(traits having more open-ended possibilities, of course).

But I think it would be a good idea to go ahead and derive Artist from
object to make sure this doesn't cause any troubles, and likewise for
the other top level classes, eg FigureCanvasBase and friends.

Yes. I fail to understand why the python VM doesn't raise an
exception of some kind when property() is called on an old-style
class. It won't work anyway, so why the hell does it fail silently???
I'm sure Eric and I are not the only people to have wasted time on
that particular trap.

Cheers,

f

···

On 3/21/07, John Hunter <jdh2358@...149...> wrote:

On 3/21/07, Fernando Perez <fperez.net@...149...> wrote: