Hello,
I use the following plot command
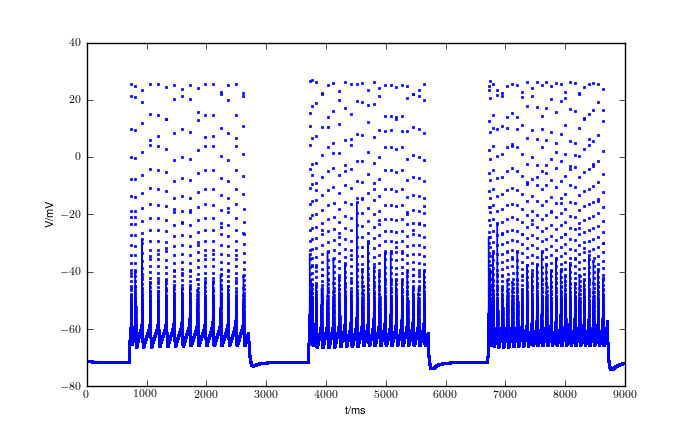
plot(tdata, vdata, '.-')
with an unexpected result (s. attached png). Some points are not
connected. If I plot with linestyle '-' you can't even see them.
Is that a known issue ? What do I do wrong ?
Hello,
I use the following plot command
plot(tdata, vdata, '.-')
with an unexpected result (s. attached png). Some points are not
connected. If I plot with linestyle '-' you can't even see them.
Is that a known issue ? What do I do wrong ?
What is your matplotlib version? Could you share the data to test it?
On the latest matplotlib source copy “.-” works nicely with a test plot like:
plt.plot(np.random.random(100), “.-”)
On Fri, Mar 26, 2010 at 3:23 AM, Ruben Moor <ruben.moor@…287…> wrote:
Hello,
I use the following plot command
plot(tdata, vdata, ‘.-’)
with an unexpected result (s. attached png). Some points are not
connected. If I plot with linestyle ‘-’ you can’t even see them.
Is that a known issue ? What do I do wrong ?
–
Gökhan
This may be the fault of the known bug in path simplification.
If you set the rcParam “path.simplify” to False does that resolve it?
(If that’s the case, this bug should be fixed in the next release).
Mike