Greetings,
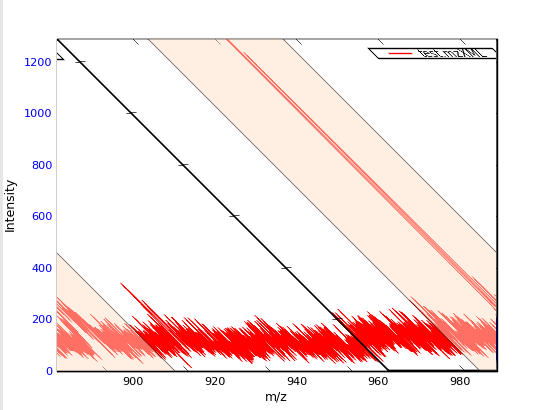
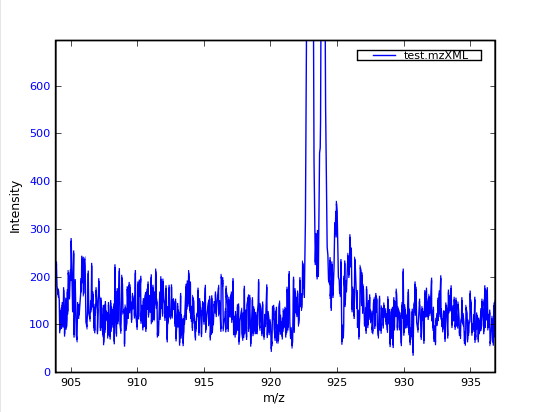
I’ve an application that uses a matplotlib canvas embedded in a PyQt4 GUI. While the overall functionality of the application is retained in both the Win32 and Linux environments, I’ve noticed an odd behavior during a zoom event using Ubuntu. I should note that the zoom event is a custom function that uses a matplotlib span widget to set the x-axis limits rather than the traditional zoom magnifier on the toolbar. I also capture the initial mouse click to set the y limit. Now on to my problem: when I use the span widget to zoom under Linux (Hardy Heron) the whole plot seems to transform itself into an odd perspective and the color of the trace changes from blue (which is the original) to red. Upon releasing the mouse button the zoomed area is set to where it should be and the color returns to blue.
Again, while the functionality is there, the behavior is annoying. Any ideas or potential fixes? I’ve attached a few snippets and screen captures of the behavior.
Upon further examination the code below does not alway reproduce the behavior. It appears to be related to the PyQt4 backend, but where I don’t know. Does it have anything to do with blitting?
Cheers,
Brian
I’m using the MPL 0.98.3, Python 2.5, and PyQt 4.3.3


···
################################
#!/usr/bin/env python
#import pylab as P
import matplotlib.pyplot as P
from matplotlib.widgets import SpanSelector
from matplotlib.widgets import Button
from matplotlib.finance import quotes_historical_yahoo
import datetime
import numpy as N
class MPL_Zoom_Test:
def init(self):
self.fig =
P.figure()
self.ax = self.fig.add_subplot(111)
self.canvas = self.fig.canvas
P.subplots_adjust(bottom=0.2)
    date1 = datetime.date( 1995, 1, 1 )
    date2 = datetime.date( 2004, 4, 12 )

    quotes = quotes_historical_yahoo(
        'INTC', date1, date2)
    if not quotes:
        raise SystemExit
    dates = [q[0] for q in quotes]
    opens = [q[1] for q in quotes]
self.ax.plot(dates, opens)
x = N.arange(25)
y = N.sin(x)
self.ax.plot(x,y)
    self.axzoom = P.axes([0.7, 0.05, 0.1, 0.075])
    self.axauto = P.axes([0.81, 0.05, 0.15, 0.075])

    self.bzoom = Button(self.axzoom, 'Zoom')
    self.bzoom.on_clicked(self.zoomToggle)
    self.bauto = Button(self.axauto, 'Autoscale')
    self.bauto.on_clicked(self.autoScale)

     self.span = SpanSelector(self.ax, self.onselect, 'horizontal', minspan =0.01, useblit=True, rectprops=dict(alpha=0.5,
facecolor=’#C6DEFF’))
self.hZoom = False
self.span.visible = False
    self.localYMax = 0
    self.canvas.mpl_connect('button_press_event', self.onclick)
    P.show()

def zoomToggle(self, event = None):
    #self.toolbar.zoom() #this implements the classic zoom
    if self.hZoom:
        self.hZoom = False
        self.span.visible = False
    else:
         self.hZoom =
True
self.span.visible = True
def autoScale(self, event = None):
    #self.toolbar.home() #implements the classic return to home
    self.ax.autoscale_view(tight = False, scalex=True, scaley=True)
    self.ax.draw()

def onclick(self, event):
    #sets up the maximum Y level to be displayed after the zoom.
    #if not set then it maxes to the largest point in the data
    #not necessarily the local max
    self.localYMax = int(event.ydata)

def onselect(self, xmin, xmax):
#print xmin, xmax
if self.hZoom:
self.ax.set_ylim(ymax = self.localYMax)
self.ax.set_xlim(xmin, xmax)
def main():
import sys
mpl = MPL_Zoom_Test()
sys.exit()
if name == “main”:
main()