The attached program generates a map and then saves it to a file. I have two
problems with the result:
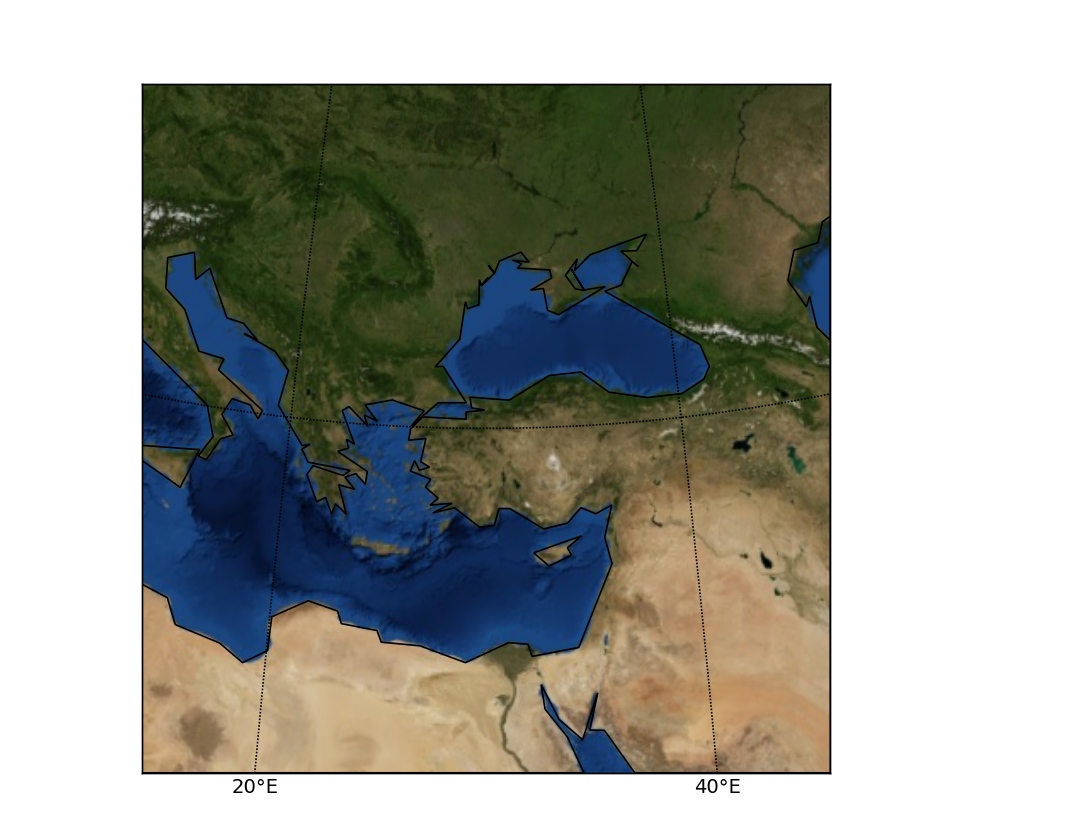
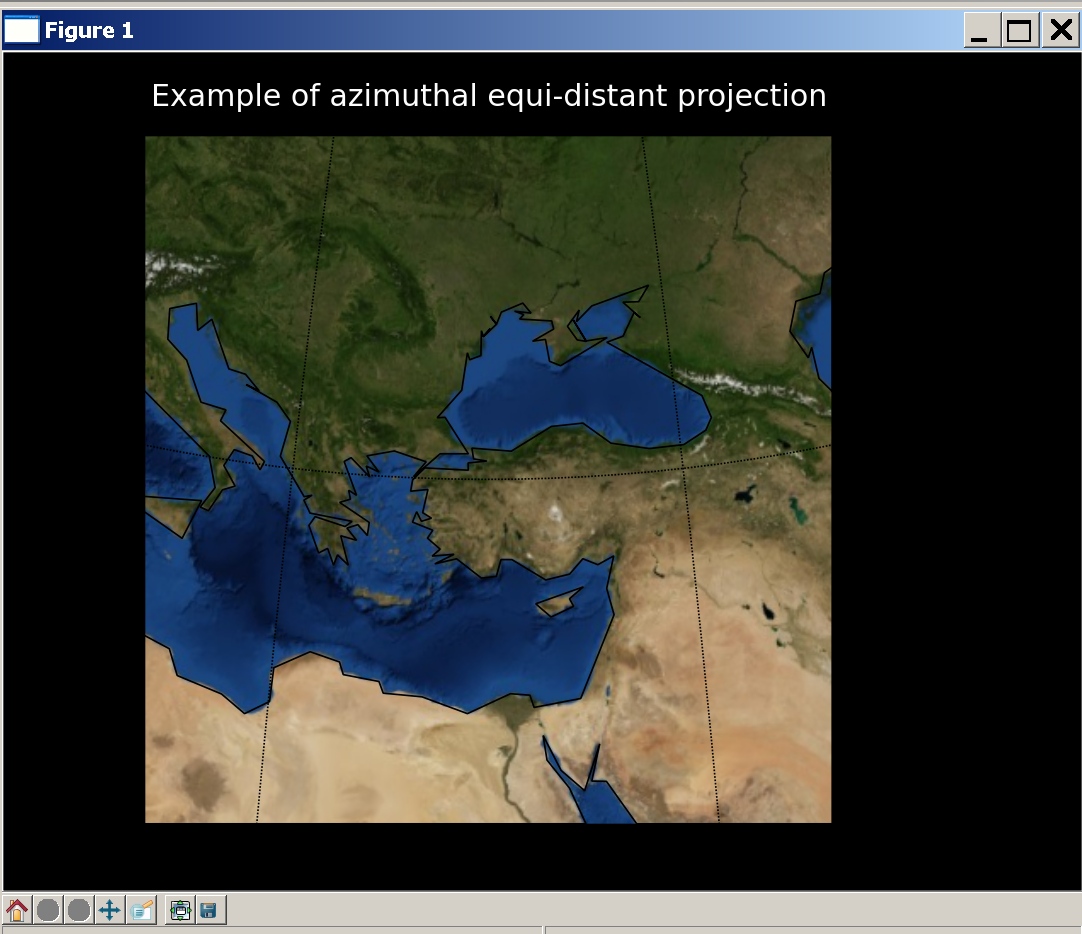
(1) Note that the screenshot shows a title above the map, while the .png
file that was saved by the program does not.
(2) I would like to be able to label the lines of latitude and longitude,
but have not been able to figure out how to do this.
Thanks!
Phillip
http://old.nabble.com/file/p27313185/mapdemo.py mapdemo.py
http://old.nabble.com/file/p27313185/mapdemo%2Bscreenshot.jpeg
http://old.nabble.com/file/p27313185/mapdemo.jpeg
···
--
View this message in context: http://old.nabble.com/two-issues-with-labels-on-maps-tp27313185p27313185.html
Sent from the matplotlib - users mailing list archive at Nabble.com.
Dr. Phillip M. Feldman wrote:
The attached program generates a map and then saves it to a file. I have two
problems with the result:
(1) Note that the screenshot shows a title above the map, while the .png
file that was saved by the program does not.
Philip:
mapdemo.jpeg (which was presumably created from the png saved by your program) is totally empty.
(2) I would like to be able to label the lines of latitude and longitude,
but have not been able to figure out how to do this.
use the label keyword to drawmeridians and drawparallels.
-Jeff
···
Thanks!
Phillip
http://old.nabble.com/file/p27313185/mapdemo.py mapdemo.py http://old.nabble.com/file/p27313185/mapdemo%2Bscreenshot.jpeg http://old.nabble.com/file/p27313185/mapdemo.jpeg
--
Jeffrey S. Whitaker Phone : (303)497-6313
Meteorologist FAX : (303)497-6449
NOAA/OAR/PSD R/PSD1 Email : Jeffrey.S.Whitaker@...259...
325 Broadway Office : Skaggs Research Cntr 1D-113
Boulder, CO, USA 80303-3328 Web : Jeffrey S. Whitaker: NOAA Physical Sciences Laboratory
Jeff Whitaker wrote:
Dr. Phillip M. Feldman wrote:
The attached program generates a map and then saves it to a file. I have two
problems with the result:
(1) Note that the screenshot shows a title above the map, while the .png
file that was saved by the program does not.
Philip:
mapdemo.jpeg (which was presumably created from the png saved by your program) is totally empty.
(2) I would like to be able to label the lines of latitude and longitude,
but have not been able to figure out how to do this.
use the label keyword to drawmeridians and drawparallels.
-Jeff
Hello Jeff,
I had tried that, but thought that it wasn't working because I wasn't seeing anything on the screen. I now think that the label parameter must be working, because the lines of latitude and longitude are labeled in the version of the map that is saved by the program, and that I'm not seeing them on the screen because I have black text on a black background. Is there a way to control the color of the text labels? Note also that the plot title appears on the screen shot jpeg, but not in the version saved by the program. Any advice will be appreciated.
Philllip
mapdemo.py (1.05 KB)
Phillip M. Feldman wrote:
Jeff Whitaker wrote:
Dr. Phillip M. Feldman wrote:
The attached program generates a map and then saves it to a file. I have two
problems with the result:
(1) Note that the screenshot shows a title above the map, while the .png
file that was saved by the program does not.
Philip:
mapdemo.jpeg (which was presumably created from the png saved by your program) is totally empty.
(2) I would like to be able to label the lines of latitude and longitude,
but have not been able to figure out how to do this.
use the label keyword to drawmeridians and drawparallels.
-Jeff
Hello Jeff,
I had tried that, but thought that it wasn't working because I wasn't seeing anything on the screen. I now think that the label parameter must be working, because the lines of latitude and longitude are labeled in the version of the map that is saved by the program, and that I'm not seeing them on the screen because I have black text on a black background. Is there a way to control the color of the text labels? Note also that the plot title appears on the screen shot jpeg, but not in the version saved by the program. Any advice will be appreciated.
Philllip
Philip: To change the color of the lat/lon lines, use the color keyword in drawparallels and drawmeridians (i.e. color="red"). To change the font color for the labels, use fontdict=dict(color='red'). The plot title color can be changed in the same way.
-Jeff
···
------------------------------------------------------------------------
------------------------------------------------------------------------
--
Jeffrey S. Whitaker Phone : (303)497-6313
Meteorologist FAX : (303)497-6449
NOAA/OAR/PSD R/PSD1 Email : Jeffrey.S.Whitaker@...259...
325 Broadway Office : Skaggs Research Cntr 1D-113
Boulder, CO, USA 80303-3328 Web : Jeffrey S. Whitaker: NOAA Physical Sciences Laboratory