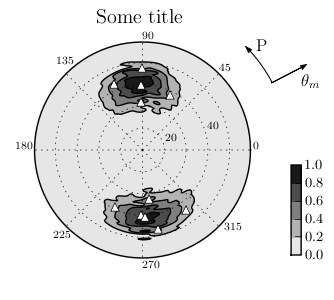
Hello, i'd like to ask two questions:
> 1) Is it possible to control amount of space between title
> and graph?
The y value of the title instance is in axes coordinates, so 1 is the
top of the axes, and numbers greater than 1 are further above the
top. So you can do
t.set.y(1.1)
where t is the matplotlib.text.Text instance returned from pylab
'title' or from matplotlib.axes.Axes.set_title (both do the same
thing).
Alternatively, you can set the title instance properties from the axes
instance
ax = fig.add_subplot(111)
ax.title.set_y(1.1)
> 2) When set_aspect() is used, the size of colorbar does not
> respect y-dimension of the graph. (See the attached
> example.) Is it possible to set the size of the colorbar
> directly?
One of the examples shows how to do this if I recall correctly, but I
don't remember which one. Eric Firing wrote it so I'm sure he'll be
along shortly to point you to the light. Eric -- perhaps we should
also add a snippet to the colorbar docstring since this is a common
request.
JDH
John Hunter wrote:
[...]
> 2) When set_aspect() is used, the size of colorbar does not
> respect y-dimension of the graph. (See the attached
> example.) Is it possible to set the size of the colorbar
> directly?
Examples of the shrink kwarg are examples/image_masked.py and examples/contour_demo.py.
As an alternative to using the shrink kwarg you can always specify axes positions manually. One example is in examples/multi_image.py. Attached is another example modified from image_masked.py.
One of the examples shows how to do this if I recall correctly, but I
don't remember which one. Eric Firing wrote it so I'm sure he'll be
along shortly to point you to the light. Eric -- perhaps we should
also add a snippet to the colorbar docstring since this is a common
request.
I have added a bit to the docstring to emphasize the function of the shrink kwarg. This will usually be the easiest manual solution to the problem. I have also thought a bit about adding functionality to the axes.draw() method that would allow the colorbar height to track the height of the mappable axes object; maybe I will try it later.
Eric
imtmp.py (1.36 KB)
Eric, John - thanks for your tips, it works!
petr

···
On Tue, 2007-01-02 at 21:01, Eric Firing wrote:
John Hunter wrote:
Examples of the shrink kwarg are examples/image_masked.py and
examples/contour_demo.py.
As an alternative to using the shrink kwarg you can always specify axes
positions manually. One example is in examples/multi_image.py.
Attached is another example modified from image_masked.py.
I have added a bit to the docstring to emphasize the function of the
shrink kwarg. This will usually be the easiest manual solution to the
problem. I have also thought a bit about adding functionality to the
axes.draw() method that would allow the colorbar height to track the
height of the mappable axes object; maybe I will try it later.
