Dear Paul,
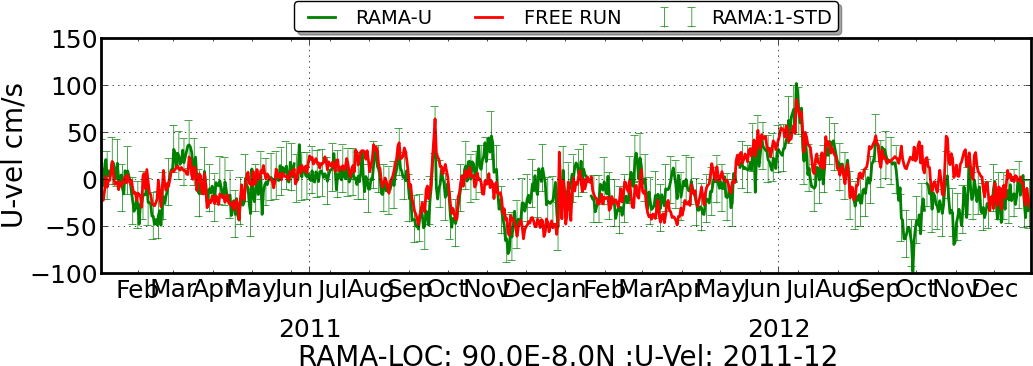
The issue I am facing is like in the attached plot where the month naming get cluttered.
with best regards,
Sudheer
···
Sudheer Joseph
Indian National Centre for Ocean Information Services
Ministry of Earth Sciences, Govt. of India
POST BOX NO: 21, IDA Jeedeemetla P.O.
Via Pragathi Nagar,Kukatpally, Hyderabad; Pin:5000 55
Tel:+91-40-23886047(O),Fax:+91-40-23895011(O),
Tel:+91-40-23044600(R),Tel:+91-40-9440832534(Mobile)
E-mail:sjo.India@…287…;sudheer.joseph@…9…
Web- http://oppamthadathil.tripod.com
From: Sudheer Joseph <sudheer.joseph@…9…>
To: Paul Hobson <pmhobson@…287…>
Cc: “matplotlib-users@…431…ists.sourceforge.net” matplotlib-users@lists.sourceforge.net
Sent: Saturday, 8 June 2013 7:46 PM
Subject: Re: [Matplotlib-users] time axis format
Thank you Paul for the helping
hand,
However I was looking for slightly different solution like in the attached plots. I used ferret to do this based on the length of the time axis it chose the mode of labelling. for example in case of 2 year plot it made month labeling as j f m etc and in case of 1 year as there is enough space on x axis it made jan feb etc with single label of year.In the attached python plot (ATser_RAMA_HYCOM_U_8n90e.png) every tick point is lablled for year, which I wanted to avoid and get plots similar to the first types thought it is not done automatically but at least
manually.
Sudheer Joseph
Indian National Centre for Ocean Information Services
Ministry of Earth Sciences, Govt. of India
POST BOX NO: 21, IDA Jeedeemetla P.O.
Via Pragathi Nagar,Kukatpally, Hyderabad; Pin:5000 55
Tel:+91-40-23886047(O),Fax:+91-40-23895011(O),
Tel:+91-40-23044600(R),Tel:+91-40-9440832534(Mobile)
E-mail:sjo.India@…287…;sudheer.joseph@…9…
Web- http://oppamthadathil.tripod.com
From: Paul Hobson <pmhobson@…287…>
To: Sudheer Joseph <sudheer.joseph@…9…>
Cc: “matplotlib-users@…564…net” matplotlib-users@lists.sourceforge.net
Sent: Friday, 7 June 2013 8:50 PM
Subject: Re: [Matplotlib-users] time axis format
On Thu, Jun 6, 2013 at 11:39 PM, Sudheer Joseph <sudheer.joseph@…9…> wrote:
Dear Experts,
I have been experimenting with the plot_dates option of matplotlib to plot time series data and have below questionsI have used
loc = mdates.AutoDateLocator()
ax.xaxis.set_major_locator(loc)
ax.xaxis.set_major_formatter(mpl.dates.DateFormatter(‘%b\n %Y’))
and got the tick labels in attached plot
However I feel the repeatd year labeling is not needed here and it is required once in a year only , Also if I need to plot long time seris insted of “MAR” “APR” I wanted to get them reduced to “M” “A” etc so that the lavel congestion can be avoided.
I notice that below options are available, but was wondering how commbinatins of these locateors are used ie mark every month and every year once each.
Is there a way to achive the above or does it need further development?
fmt = mdates.DateFormatter(‘%Y-%m-%d’)
loc = mdates.WeekdayLocator(byweekday=mdates.MONDAY,interval=4)
locator = mdates.YearLocator()
If I were trying to do this, I’d cobble something together using by the minor and major formatters.
e.g.,…
import matplotlib.dates as mdates
import matplotlib.pyplot as plt
fig, ax = plt.subplots()
majorLocs = mdates.MonthLocator(bymonth[1,7])
majorFmt = mdates.DateFormatter(‘%b\n%Y’)
minorLocs = mdates.MonthLocator(bymonth[1,7])
minorFmt = mdates.DateFormatter(‘%b’)
ax.xaxis.set_major_locator(majorLocs)
ax.xaxis.set_major_formatter(majorFmt)
ax.xaxis.set_minor_locator(minorLocs)
ax.xaxis.set_minor_formatter(minorFmt)